#13,950
Influenza activity, which showed signs of peaking twice earlier in the season (see ILI chart below), continues to reinvigorate itself with late season surge in H3N2 activity.

While most of the illnesses in this 2018-2019 winter flu season have been due to H1N1,in the past week, 65% of virus samples tested by the CDC were H3N2. The percentage of H3N2 viruses falling into the rising 3C.3a clade - which in week 44 only comprised 4% of H3N2 viruses sampled - has risen to 65%.

Even more remarkably, the CDC has analyzed 102 H3N2 viruses over the past two reporting weeks, and of those 92 (90%) belong to this rising clade. A big reason why yesterday, the WHO Selected the Fall H3N2 Flu Shot Component: Clade 3C.3a.
A few excerpts from today's FluView report, followed by a snapshot estimate of this flu season's burden the public's health.
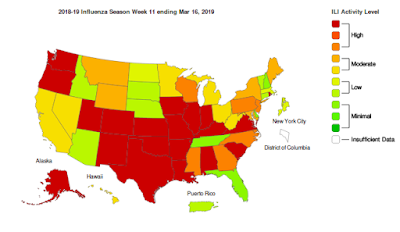
2018-2019 Influenza Season Week 11 ending March 16, 2019
All data are preliminary and may change as more reports are received.An overview of the CDC influenza surveillance system, including methodology and detailed descriptions of each data component, is available at http://www.cdc.gov/flu/weekly/overview.htm.Synopsis:
Influenza activity remains elevated in the United States. Influenza A(H1N1)pdm09, influenza A(H3N2), and influenza B viruses continue to co-circulate. Below is a summary of the key influenza indicators for the week ending March 16, 2019:
- Viral Surveillance:The percentage of respiratory specimens testing positive for influenza viruses in clinical laboratories increased slightly. Nationally, during the most recent three weeks, influenza A(H3) viruses were reported more frequently than influenza A(H1N1)pdm09 viruses and in HHS Regions 2, 4, 5, 6, 7, 8, 9 and 10.
- Virus Characterization:The majority of influenza viruses characterized antigenically are similar to the cell-grown reference viruses representing the 2018–2019 Northern Hemisphere influenza vaccine viruses. However, an increasing proportion of influenza A(H3N2) viruses are antigenically distinguishable from A/Singapore/INFIMH-16-0019/2016 (3C.2a1), a cell-propagated reference virus representing the A(H3N2) component of 2018-19 Northern Hemisphere influenza vaccines.
- Antiviral Resistance:The vast majority of influenza viruses tested (>99%) show susceptibility to oseltamivir and peramivir. All influenza viruses tested showed susceptibility to zanamivir.
- Influenza-like Illness Surveillance:The proportion of outpatient visits for influenza-like illness (ILI) remained at 4.4%, which is above the national baseline of 2.2%. All 10 regions reported ILI at or above their region-specific baseline level.
- ILI State Activity Indictor Map: 26 states experienced high ILI activity; 12 states experienced moderate ILI activity; New York City, Puerto Rico and eight states experienced low ILI activity; four states experienced minimal ILI activity; and the U.S. Virgin Islands and the District of Columbia had insufficient data.
- Geographic Spread of Influenza: The geographic spread of influenza in 44 states was reported as widespread; Puerto Rico and four states reported regional activity; the District of Columbia and two states reported local activity; the U.S. Virgin Islands reported sporadic activity; and Guam did not report.
- Influenza-associated Hospitalizations A cumulative rate of 47.1 laboratory-confirmed influenza-associated hospitalizations per 100,000 population was reported. The highest hospitalization rate is among adults 65 years and older (146.0 hospitalizations per 100,000 population).
- Pneumonia and Influenza Mortality: The proportion of deaths attributed to pneumonia and influenza (P&I) was below the system-specific epidemic threshold in the National Center for Health Statistics (NCHS) Mortality Surveillance System.
- Influenza-associated Pediatric Deaths: Eight influenza-associated pediatric deaths were reported to CDC during week 11.
While this year's estimated flu burden still pales when compared to last year's severe H3N2 season, the numbers continue to climb, and the season may have several more active weeks ahead.
