
# 7323
Today is day two of Hurricane Preparedness week, with today’s emphasis on deadly storm surge, the effects of which are well illustrated in the two photographs above.
Parts of New Jersey and New York state saw wind driven surge tides rise more than 15 feet, more than enough to toss boats around like toys, and sweep houses off their foundations.

First a short video from the NHC on storm surge, then a visit to NOAA’s storm surge information page.

Storm Surge Overview
Along the coast, storm surge is often the greatest threat to life and property from a hurricane. In the past, large death tolls have resulted from the rise of the ocean associated with many of the major hurricanes that have made landfall. Hurricane Katrina (2005) is a prime example of the damage and devastation that can be caused by surge. At least 1500 persons lost their lives during Katrina and many of those deaths occurred directly, or indirectly, as a result of storm surge.Storm Surge vs. Storm Tide
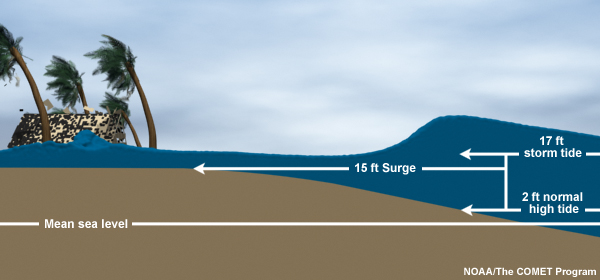
Storm surge is an abnormal rise of water generated by a storm, over and above the predicted astronomical tides. Storm surge should not be confused with storm tide, which is defined as the water level rise due to the combination of storm surge and the astronomical tide. This rise in water level can cause extreme flooding in coastal areas particularly when storm surge coincides with normal high tide, resulting in storm tides reaching up to 20 feet or more in some cases.

Storm Surge vs. Storm Tide
Back in 2011, in Getting SLOSHed For Hurricane Season I wrote about the Sea, Lake and Overland Surges from Hurricanes computer model that emergency planners use to plan for coastal evacuations.
In order to know in advance how far inland a storm surge or tide will encroach, emergency planners run hundreds of SLOSH models for populated regions along the coast.

They vary the size, intensity, direction, and forward speed of hurricanes in the model in order to determine the worst case impact for each category of storm.
Evacuation maps and routes are then generated using this information.
This evacuation map of Pinellas County (St. Petersburg-Clearwater) Florida shows that a storm even as low as a CAT 3 could temporarily cut the southern half of the county off from the north.

Of course much depends upon the speed, direction, and point of landfall of the storm, and so not all CAT 3 storms impacting this area would produce this dramatic of an effect.
But if you are asked to evacuate by your local authorities, don’t hesitate.
Just do it.
When it comes to getting the latest information on hurricanes, your first stop should always be the National Hurricane Center in Miami, Florida. These are the real experts, and the only ones you should rely on to track and forecast the storm.
If you are on Twitter, you should also follow @FEMA, @CraigatFEMA, @NHC_Atlantic, @NHC_Pacific and @ReadyGov.
And finally, if you haven’t already downloaded the updated Tropical Cyclone Preparedness Guide, now would be an excellent time to do so.