
#14,005
The marathon 2018/2019 US flu season - which began in early December - continues well into its 4th month, although activity reports continue dwindle across the nation (see map below).

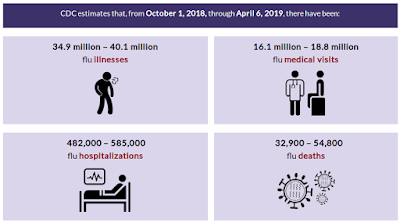
While a far cry from the 900,000 hospitalizations and 80,000 deaths due to the last (2017-28) flu season, what started off last fall as a mild-to-moderate flu season has - over the past few months - surged into the moderately-severe range.
This propels this season into roughly the same severity range as the 2014-15 and and 2016-17 flu seasons.
A prime factor in this abrupt turnaround has been a mid-season switch from an H1N1 to an H3N2 dominated season - and the concurrent rise in upstart H3N2 clade 3C.3a that was barely on our radar 5 months ago (see WHO Selects Fall H3N2 Flu Shot Component: Clade 3C.3a).A few snippets from today's FluView summary follow.
2018-2019 Influenza Season Week 14 ending April 6, 2019
All data are preliminary and may change as more reports are received.
An overview of the CDC influenza surveillance system, including methodology and detailed descriptions of each data component, is available at http://www.cdc.gov/flu/weekly/overview.htm.Synopsis:
Influenza activity continues to decrease but remains elevated in the United States. Influenza A(H1N1)pdm09 viruses predominated from October to mid-February, and influenza A(H3N2) viruses have been more commonly identified since late February. Small numbers of influenza B viruses have also been reported. Below is a summary of the key influenza indicators for the week ending April 6, 2019:
- Viral Surveillance:The percentage of respiratory specimens testing positive for influenza viruses in clinical laboratories decreased. Nationally, during the most recent three weeks, influenza A(H3) viruses were reported more frequently than influenza A(H1N1)pdm09 viruses and in all 10 HHS Regions.
- Virus Characterization:The majority of influenza viruses characterized antigenically are similar to the cell-grown reference viruses representing the 2018–2019 Northern Hemisphere influenza vaccine viruses. However, an increasing proportion of influenza A(H3N2) viruses are antigenically distinguishable from A/Singapore/INFIMH-16-0019/2016 (3C.2a1), a cell-propagated reference virus representing the A(H3N2) component of 2018-19 Northern Hemisphere influenza vaccines.
- Antiviral Resistance:The vast majority of influenza viruses tested (>99%) show susceptibility to oseltamivir and peramivir. All influenza viruses tested showed susceptibility to zanamivir.
- Influenza-like Illness Surveillance:The proportion of outpatient visits for influenza-like illness (ILI) decreased to 2.8%, and remains above the national baseline of 2.2%. Nine of 10 regions reported ILI at or above their region-specific baseline level.
- ILI State Activity Indictor Map: Four states experienced high ILI activity; eight states experienced moderate ILI activity; New York City and 21 states experienced low ILI activity; the District of Columbia, Puerto Rico and 17 states experienced minimal ILI activity; and the U.S. Virgin Islands had insufficient data.
- Geographic Spread of Influenza: The geographic spread of influenza in 20 states was reported as widespread; Puerto Rico and 25 states reported regional activity; the District of Columbia and five states reported local activity; the U.S. Virgin Islands reported sporadic activity; Guam did not report.
- Influenza-associated Hospitalizations A cumulative rate of 59.9 laboratory-confirmed influenza-associated hospitalizations per 100,000 population was reported. The highest hospitalization rate is among adults 65 years and older (195.9 hospitalizations per 100,000 population).
- Pneumonia and Influenza Mortality: The proportion of deaths attributed to pneumonia and influenza (P&I) was below the system-specific epidemic threshold in the National Center for Health Statistics (NCHS) Mortality Surveillance System.
- Influenza-associated Pediatric Deaths: Four influenza-associated pediatric deaths were reported to CDC during week 14.