 |
| ILI Visits - Week 5 2018 - CDC FluView |
#13,629
Last year's high-severe non-pandemic flu season continues to set records, as the CDC and others comb through the numbers, run mathematical models, and try to quantify its impact.
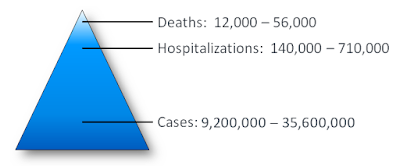
It is an enormous undertaking, and this unusually severe flu season will likely be studied, and the numbers refined, for years to come.Although the CDC has an `expected range' of seasonal influenza hospitalizations and deaths (see chart below), even without a novel virus, it is possible to see an unusually severe `outlier' season.
Last January, in Why Flu Fatality Numbers Are So Hard To Determine,
we looked at some of the statistical methodology used by the CDC, and by individual states, to come up with an estimate of the burden of influenza each winter.
Over the summer, some of the post-flu-season analyses we've looked at include:
CDC: More Than 900,000 Hospitalizations & 80,000 Deaths In Last Winter's Flu SeasonThis week the CDC has released their latest updated estimate (subject to a number of limitations), of the burden of last year's flu season. As the chart below shows, the models actually provide a range, and the actual numbers could be higher than quoted in the article.
CDC: Classifying Influenza Season Severity
CDC Statement On Record Pediatric Flu-Related Deaths
MMWR: Reviewing Our High Severity 2017-2018 Flu Season
I've only included some excerpts, so follow the link the read the full report (including limitations).
Estimated Influenza Illnesses, Medical visits, Hospitalizations, and Deaths in the United States — 2017–2018 influenza season
IntroductionConclusion
This web page provides estimates on the burden of influenza in the United States for the 2017–2018 influenza season. For the past several years, CDC has used a mathematical model to estimate the numbers of influenza illnesses, medical visits, and hospitalizations 1-4. The methods used to calculate the estimates have been described previously 1. CDC uses the estimates of the burden of influenza in the population to inform policy and communications related to influenza.
2017–2018 Estimates
Influenza activity in the United States during the 2017–2018 season began to increase in November and remained at high levels for several weeks during January–February5. While influenza A(H3N2) viruses predominated through February, and were predominant overall for the season, influenza B viruses were more commonly reported starting in March, 2018. The season had high severity with unusually high levels of outpatient influenza-like illness, hospitalizations rates, and proportions of pneumonia and influenza-associated deaths.
CDC estimates that the burden of illness during the 2017–2018 season was also high with an estimated 48.8 million people getting sick with influenza, 22.7 million people going to a health care provider, 959,000 hospitalizations, and 79,400 deaths from influenza (Table 1). The number of cases of influenza-associated illness that occurred last season was the highest since the 2009 H1N1 pandemic, when an estimated 60 million people were sick with influenza6.
The 2017–2018 influenza season was additionally atypical in that it was severe for all ages of the population5. The burden of influenza and the rates of influenza-associated hospitalization are generally higher for the very young and the very old, and while this was also true during the 2017–2018 season, rates of hospitalization in all age groups were the highest seasonal rates seen since hospital-based surveillance was expanded in 2005 to include all ages (Table 2). This translated into an estimated 11.5 million cases of influenza in children, 30 million cases of influenza in working age adults (aged 18-64 years), and more than 7.3 million cases in adults aged 65 years and older.
Our estimates of hospitalizations and mortality associated with the 2017–2018 influenza season continue to demonstrate how severe influenza virus infection can be. We estimate overall, there were 959,000 hospitalizations and 79,400 deaths during the 2017–2018 season. More than 48,000 hospitalizations occurred in children (aged < 18 years); however, 70% of hospitalizations occurred in older adults aged ≥65 years. Older adults also accounted for 90% of deaths, highlighting that older adults are particularly vulnerable to severe disease with influenza virus infection. An estimated 10,300 deaths occurred among working age adults (aged 18–64 years), an age group that often has low influenza vaccination.
Deaths in children with laboratory-confirmed influenza virus infection are reportable in the United States and 183 deaths were reported for the 2017–2018 season. However, influenza-associated pediatric deaths are likely under-reported as not all children whose death was related to an influenza virus infection may have been tested for influenza 7, 8. Therefore, we used a mathematical model to estimate the total number of pediatric deaths based on hospitalization rates and the frequency of death in and out of the hospital from death certificates, estimating that there were more than 600 deaths associated with influenza in children.
CDC estimates that influenza was associated with more than 48.8 million illnesses, more than 22.7 million medical visits, 959,000 hospitalizations, and 79,400 deaths during the 2017–2018 influenza season. This burden was higher than any season since the 2009 pandemic and serves as a reminder of how severe seasonal influenza can be.
Limitations
These estimates are subject to several limitations.
(Continue . . . )
While there are hopeful signs that this year's flu season may be less severe, we never really know what kind of flu season we'll see until it is over. Good reasons to get the seasonal flu shot each fall, and to practice good flu hygiene year round.

