#17,277
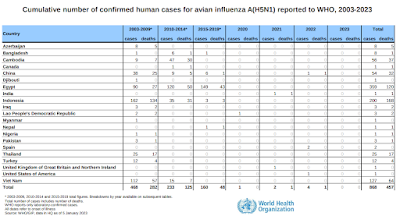
With the recent spread of avian H5N1 (clade 2.3.4.4b) to humans and other mammals, including signs of efficient mammal-to-mammal spread among farmed mink in Spain, a lot of attention is being paid to the 20 year-history of H5N1 infection in humans, and its apparent high fatality rate (see WHO Chart above).
Of the 868 known infections with (various clades) of H5N1 since 2003, 457 (52%) proved fatal.
A closer look at this chart reveals that while the CFR in Indonesia ran a staggering 84%, in Egypt is was just over 33%. In Bangladesh, it was even lower, at just 12%.
Differences in medical care, and the availability (and use) of antivirals may have been factors, and some clades of the virus may have been less virulent than others. But regardless of those factors, in almost every case, only people sick enough to be hospitalized were likely to be tested for the virus.
This practice alone ensures that most mild and/or moderate infections were never counted, artificially raising the CFR.
While we don't know how many mild and/or moderate H5N1 infections escaped detection, of the 7 known human infections with this newest clade, 4 were either mild or asymptomatic, while 3 were severe (and one of those proved fatal).
And of course, we don't know how many other mild cases may have gone unnoticed.
Since we don't have a good handle on the denominator - the total number of people infected - we can't reliably calculate the CFR. This lack of data has sparked many debates over the years (see mBio: Mammalian-Transmissible H5N1 Influenza: Facts and Perspective).
Following the first epidemic wave of H7N9 in China in 2013, researchers at the University of Hong Kong attempted to estimate the total number of cases in China (see Lancet: Clinical Severity Of Human H7N9 Infection).Despite enhanced surveillance and testing, only 123 cases were laboratory confirmed (37 fatal) in the opening months, producing a 30% fatality rate.
Our estimate that between 1500 and 27 000 symptomatic infections with avian influenza A H7N9 virus might have occurred as of May 28, 2013, is much larger than the number of laboratory-confirmed cases.
They further calculated that the `symptomatic CFR’ of the virus probably ran between .16% and 2.8%. The authors warned that this estimate relied on a number of `simplifying assumptions’, and should therefore be viewed cautiously.
Lest anyone trivialize a 3% CFR, that would still be between 2 and 3 times deadlier than COVID; comparable to the 1918 pandemic, and it could run higher. And it is possible that H5N1 might take aim at a younger cohort, as did H1N1 a little over century ago.
While H7N9 (and COVID) have tended to and produce severe illness more in older patients, H5N1 has historically shown a predilection for children and young adults (see H7N9: The Riddle Of The Ages).
While the reasons behind this aren't entirely clear, in 2010's EID Journal: Original Antigenic Sin And Pandemic H1N1, we looked at a highly plausible explanation; that the first flu subtype you are exposed to in life creates a lasting impression on your immune system.
Again, in 2016's Science: Protection Against Novel Flu Subtypes Via Childhood HA Imprinting, we looked at research which suggested the influenza HA Group type you are first exposed to makes a significant, and lasting, impression on your immune system.

While more theoretical than proven, this suggests if your first influenza exposure was to H1N1 or H2N2 (group 1), you may carry some degree of immunity to the H5 viruses, while if your first exposure was to H3N2 (group 2), you may carry some protection against H7 viruses instead (see Nature: Declan Butler On How Your First Bout Of Flu Leaves A Lasting Impression).
Those born before 1968 would only have been exposed to an HA Group 1 virus in their childhood, while anyone born between 1968 and 1977 would have been exposed to a type II virus.
Those born after 1977 could have been exposed first to either.
While no age group would emerge unscathed from an H5N1 epidemic, we could see - as we did in 1918 (see chart below) - a skewing of severity towards younger age groups.

The infamous `W shaped curve’ of the 1918 pandemic clearly shows that the death rates among those in their teens, 20s, and 30s was much higher those in their 50's and 60's.
Trying to predict what an H5N1 pandemic would look like is probably a mug's game. There is an old adage among pandemic watchers; That if you've seen one pandemic, you've seen one pandemic.
Suffice to say another novel virus will emerge. It is only a matter of when. The only thing we can do today is prepare for the unexpected in order not to be caught flat-footed again.
Sadly, I see few signs of that happening.