
#19,078
During the latter half of the 20th century Asia - and China in particular - had earned the reputation of being the `cradle of influenza', and was considered the most likely source of the next pandemic virus.
While ignoring the 1918 outlier, the last 2 pandemics of the last century (1957 & 1958) had both emerged from that part of the world, and in 1996 a new novel flu threat - H5N1 - had briefly emerged in Hong Kong.
Over the past quarter century China/Asia has served as the launching pad for a variety of novel flu viruses (HPAI H5N1, H5N6, H5N8, LPAI/HPAI H7N9 . . among others), along with both SARS-CoV and SARS-CoV-2 (COVID).
But there have been notable exceptions; the 2009 H1N1 pandemic emerged from North American pigs, MERS-CoV was first detected on the Arabian peninsula (although it likely came from camels imported from Africa), and we've seen other threats - like Mpox and Ebola - emerge from Africa as well.
While it is unlikely there will ever be a one-size-fits-all-viruses model, researchers continue to try to find ways to predict where the next pandemic virus will come from, in hopes that targeted surveillance might help contain it - or at least provide early warning.
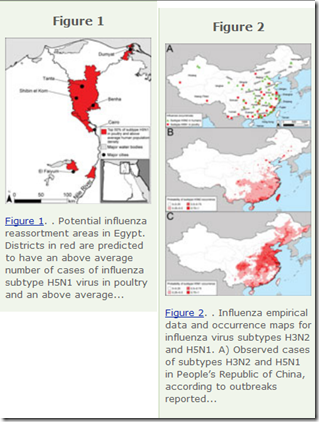
In 2013's EID Journal: Predicting Hotspots for Influenza Virus Reassortment, we looked at a study that identified 6 key geographic regions where influenza A reassortments were mostly likely to emerge. As you might expect, high on their list was Eastern mainland China.
Potential geographic foci of reassortment include the northern plains of India, coastal and central provinces of China, the western Korean Peninsula and southwestern Japan in Asia, and the Nile Delta in Egypt.
Since then, we've seen a number of attempts to identify `hotspots' for viral spillovers.
Almost exactly 4 years before COVID-19 emerged, we looked at a study of potential hotspots for the emergence of novel bat viruses (see Study: Hotspots For Bat To Human Disease Transmission).

For novel influenza A viruses, wild migratory birds have driven most of its global spread and spillovers into poultry, small mammals, and livestock (including cattle).
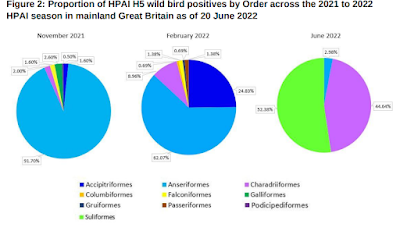
While originally thought largely limited to aquatic birds (Anseriformes), in recent years HPAI's host range has greatly expanded (see DEFRA: The Unprecedented `Order Shift' In Wild Bird H5N1 Positives In Europe & The UK).

Quite unexpectedly, Strigiformes (owls) had the strongest transmission capacity, with an R0 of 3.164. Previously owls (and raptors in general) had been thought highly susceptible, but likely to succumb before spreading the virus. Anseriformes (waterfowl), surprisingly, had the weakest transmission capacity, with an R0 of 0.992.
Today we've another study that uses migratory waterbird tracking - albeit on far more ambitious global scale - to map global risk patterns for HPAI spillover to humans, cattle, and poultry.
Using citizen-scientist observation data (e.g., GBIF or eBird) and machine learning, the authors created species distribution models (SDMs) to map, on a monthly basis, where 779 waterbird species can be found worldwide.
From this, they created a `waterbird activity entropy' (WAE) index number, which they compared to known spillovers in those regions. They found that a higher WAE number correlated strongly to more spillovers.Finally, they combined WAE numbers with maps of human, cattle, and poultry density to identify potential `hotspots', where spillovers would be most likely, and which could benefit most from surveillance and biosecurity measures.

As the map above illustrates, they cite four large regions as potential hotspots for HPAI spillover" the USA, the European Union, China, and India. They do, however, point out limited surveillance in sub-Saharan Africa.
Notably, the AIV exposure hotspots in the USA, EU, China, and India contain 52% of the globally exposed human population, 41% cattle, and 51% poultry.
Despite reporting <1% of global cases, sub -Saharan Africa contains >300 Mha of hotspots area (15% globally ), highlighting considerable surveillance gaps.
This WAE -based framework enhances AIV risk assessment by incorporating waterbird residency time, offering critical insights for anticipating AIV emergence and improving surveillance.This is a fascinating study, which provides a unique reusable global map of waterbird-driven avian flu hotspots, which will hopefully help countries prioritize surveillance, and allocate resources, in our ongoing battle against avian flu.
Mapping global avian influenza risk patterns through waterbird activity entropy
Yuzhe Li, Yuxin Qiao, Yue Zhan, Jinwei Dong, Mariëlle van Toor, Jonas Waldenström, A. Townsend Peterson, Qiang Zhang, Zhichao Li, Weipan Lei, Fanshu Du, Juan Pu, Dayan Wang & Xiangming Xiao
Nature Communications , Article number: (2026) Cite this article
We are providing an unedited version of this manuscript to give early access to its findings. Before final publication, the manuscript will undergo further editing. Please note there may be errors present which affect the content, and all legal disclaimers apply.
Abstract
Avian influenza viruses (AIV) pose a major zoonotic threat with pandemic potential. Waterbirds facilitate AIV spillovers into farm animals and humans through exposure and virus reassortment.
Here, we propose waterbird activity entropy (WAE), an indicator of waterbird activity intensity based on monthly distributions of 779 species worldwide. WAE demonstrated high explanative power (AUC = 0.87 ± 0.001) for global avian influenza cases, particularly for H5N1, revealing the potential of WAE for identifying AIV exposure hotspots which cover 14% of global land area.
Notably, the AIV exposure hotspots in the USA, EU, China, and India contain 52% of the globally exposed human population, 41% cattle, and 51% poultry. Despite reporting <1% of global cases, sub-Saharan Africa contains >300 Mha of hotspots area (15% globally), highlighting considerable surveillance gaps.
This WAE-based framework enhances AIV risk assessment by incorporating waterbird residency time, offering critical insights for anticipating AIV emergence and improving surveillance.
IntroductionThe last four influenza pandemics (in 1918, 1957, 1968, and 2009) originated primarily from avian influenza virus (AIV) strains or genetic reassortment of AIV 1,2. Most spillover events among domestic animals and humans are related to various AIVs carried by bird species associated with wetlands , aquatic , and marine habitats 3,4 (hereafter waterbirds).
These various and recurring reassortments, coupled with frequent interactions between wild waterbirds and domestic animals, facilitate the virus ’s ability to cross between diverse host species 5,6, including wild and domestic birds, mammals, and occasionally humans 7,8 . For example, highly pathogenic avian influenza (HPAI) subtype H5N1 viruses have rapidly expanded their host range among waterbirds (especially long -distance migratory seabird and shorebird species) in recent years , increasing the risk of cross -continental spreading of emerging AIVs 3,9 . Therefore, identification of waterbird diversity and activity is significant, with a high risk of AIV spillover from natural ecosystems
As waterbirds are the primary AIV reservoir host 4 , this study provides an exposure risk analysis framework that considers the effects of migrating waterbirds in the context of climate and land use status. This framework enables a more accurate and balanced assessment of avian influenza risk, particularly in developing countries with limited surveillance resources. By addressing these interconnected factors, this study aligns with the One Health strategy, which considers different interfaces among waterbirds, poultry, cattle, and humans 38 , to predict and manage AIV risk more effectively in the future.