Showing posts with label FluWatch. Show all posts

Saturday, January 03, 2015

Canada FluWatch Report Week 51

image

Map of overall influenza/ILI activity level by province and territory, Canada, Week 51


# 9526


Due to the Holidays our regularly scheduled Friday CDC FluView report will be released on Monday, but all signs are pointing to another hefty increase in flu activity across the country. Influenza surveillance and reporting during the second half of December is always problematic, and the data often lags behind by an extra week or so getting to the CDC.


We do have Canada’s latest FluWatch report – which reflects their flu activity as of December 20th. 


Not surprisingly, they too are seeing an increasingly tough flu season, with H3N2 far and away the predominant flu strain, and with most of the H3 viruses examined a poor match for this year’s flu vaccine (see HAN Advisory On `Drifted’ H3N2 Seasonal Flu Virus).

Between it being an H3N2 year – a subtype which often produces more severe seasons than H1N1 – and reduced vaccine effectiveness, there are concerns that the next couple of months may be particularly rough (see Early Data Suggests Potentially Severe Flu Season).


Some excepts from a much longer, data rich report:


FluWatch report: December 14 to December 20, 2014 (Week 51)

Posted 2015-01-02

 Overall Summary

  • In week 51, laboratory detections of influenza increased sharply for the fifth consecutive week. The majority of laboratory detections continued to be reported in AB, ON and QC; but with increasing activity in SK and NL.
  • A(H3N2) continues to be the most common type of influenza affecting Canadians. In both laboratory detections and hospitalizations, the majority of cases have been among seniors ≥65 years of age.
  • Similar to the previous week, there were a large number of newly-reported laboratory-confirmed outbreaks of influenza: 125 influenza outbreaks in 7 provinces, of which 94 were in long-term care facilities (LTCF).
  • The rate of antiviral prescriptions more than doubled from the previous week, increasing especially among seniors.

Influenza and Other Respiratory Virus Detections

In week 51, the number of positive influenza tests increased sharply to 2,833 influenza detections (29.1% of tests), predominantly due to influenza A (Figure 2). To date, 97% of influenza detections have been influenza A, and 99.8% of those subtyped have been A(H3) (Table 1). The timing of the season and predominant A(H3N2) subtype is similar to the pattern observed during the 2012-13 influenza season when percent positive for influenza peaked in week 52 (35%). To date, among the cases of influenza with reported age, the largest proportion was in adults ≥65 years of age (56%) (Table 2).

Figure 2. Number of positive influenza tests and percentage of tests positive, by type, subtype and report week, Canada, 2014-15


Influenza Strain Characterizations

During the 2014-2015 influenza season, the National Microbiology Laboratory (NML) has characterized 59 influenza viruses [37 A(H3N2), 2 A(H1N1) and 20 influenza B]. Influenza A (H3N2): When tested by hemagglutination inhibition (HI) assay, 31 of the 37 A(H3N2) viruses characterized were antigenically similar to A/Switzerland/9715293/2013, which is the influenza A(H3N2) component recommended for the 2015 Southern Hemisphere influenza vaccine. One was antigenically similar to A/Texas/50/2012, which is the influenza A(H3N2) component recommended for the 2014-15 influenza vaccine. The remaining five A(H3N2)viruses showed reduced titer to A/Texas/50/2012.

Additionally, 112 A(H3N2)viruses were unable to be tested by HI assay; however, sequence analysis showed that 111 belonged to a genetic group that typically shows reduced titers to A/Texas/50/2012. Influenza A(H1N1): Two A(H1N1) viruses characterized were antigenically similar to A/California/7/2009, which is the influenza A(H1N1) component recommended for the 2014-15 influenza vaccine. Influenza B: Of the 20 influenza B viruses characterized, 17 viruses were antigenically similar to the vaccine strain B/Massachusetts/2/2012. Three viruses showed reduced titers with antiserum produced against strains recommended for the seasonal influenza vaccine (Figure 4).

Figure 4. Influenza strain characterizations, Canada, 2014-2015, N = 59

The NML receives a proportion of the number of influenza positive specimens from provincial laboratories for strain characterization and antiviral resistance testing. Characterization data reflect the results of haemagglutination inhibition (HAI) testing compared to the reference influenza strains recommended by WHOExternal site.

The recommended components for the 2014-2015 northern hemisphere trivalent influenza vaccine include: an A/California/7/2009(H1N1)pdm09-like virus, an A/Texas/50/2012 (H3N2)-like virus, and a B/Massachusetts/2/2012-like virus (Yamagata lineage). For quadrivalent vaccines, the addition of a B/Brisbane/60/2008-like virus is recommended.


Despite its reduced effectiveness, the CDC continues to recommend that people get the flu shot – partially because it may provide some modicum of protection against this drifted flu strain, but mostly because we often see a wave of Influenza B late in the flu season, and the shot can help protect against that virus.


Beyond that, practicing good flu hygiene; Staying home when sick, washing your hands, covering your coughs, and disposing of your tissues properly are all important habits to maintain during this flu season.

Saturday, December 20, 2014

Canada: FluWatch Week 50


image

Credit Canada’s FluWatch 


# 9468


Yesterday we looked at the CDC’s latest FluView Week 50 report, and so this morning a quick peek at flu conditions north of the border. 


Like in the United States, Canada is seeing sharply increased flu activity, and the vast majority of H3N2 viruses tested are falling into the `drifted’ category – making them a poor match to this year’s vaccine (see HAN Advisory On `Drifted’ H3N2 Seasonal Flu Virus).


Here then are some excepts from a much larger report:


FluWatch report: December 7 to 13, 2014 (Week 50)

Posted 2014-12-19

 Overall Summary

  • In week 50, laboratory detections of influenza increased sharply for the fourth consecutive week. The majority of laboratory detections continued to be reported in AB, ON and QC; but with increasing activity in SK, MB and NL.
  • A(H3N2) continues to be the most common type of influenza affecting Canadians. In both laboratory detections and hospitalizations, the majority of cases have been among seniors ≥65 years of age.
  • Similar to the previous week, there were a large number of newly-reported laboratory-confirmed outbreaks of influenza: 72 influenza A outbreaks in 8 provinces, of which 57 were in long-term care facilities (LTCF).
  • To date, the NML has found that the majority H3N2 influenza specimens are not optimally matched to the vaccine strain which may result in reduced vaccine effectiveness against the H3N2 influenza virus. However, the vaccine can still provide some protection against H3N2 influenza illness and can offer protection against other influenza strains such as A(H1N1) and B.

<SNIP>

Figure 2. Number of positive influenza tests and percentage of tests positive, by type, subtype and report week, Canada, 2014-15

<SNIP>

Influenza Strain Characterizations

During the 2014-2015 influenza season, the National Microbiology Laboratory (NML) has characterized 30 influenza viruses [13 A(H3N2), 2 A(H1N1) and 15 influenza B]. When tested by hemagglutination inhibition (HI) assay, one influenza A (H3N2) virus was antigenically similar to A/Texas/50/2012, two influenza A (H1N1) viruses were antigenically similar to A/California/7/2009 and 12 influenza B viruses were antigenically similar to the B/Massachusetts/2/2012 (Yamagata lineage) recommended by the WHO for the 2014-15 seasonal influenza vaccine. Five influenza A(H3N2) viruses and three influenza B viruses showed reduced titers to antisera produced against strains recommended for the seasonal influenza vaccine. Seven of the 13 influenza A (H3N2) viruses were antigenically similar to the A/Switzerland/9715293/2013, which is the influenza A/H3N2 component recommended for the 2015 Southern Hemisphere influenza vaccine (Figure 4). Additionally, 58 A(H3N2) viruses were unable to be tested by HI assay; however, sequence analysis showed that 57 belonged to a genetic group that typically shows reduced titers to A/Texas/50/2012.

Figure 4. Influenza strain characterizations, Canada, 2014-2015, N = 30

 (Continue . . .)


Although the timing of the peak of flu season varies from year to year, often we see a big jump in numbers right after students return to their classrooms in the new year.  


This week’s FluWatch also carries this statement regarding the outbreak of H5N2 in poultry in British Columbia:


Avian Influenza A(H5)
The Canadian Food Inspection Agency (CFIA) is continuing its investigation into an outbreak of highly pathogenic avian influenza H5N2 virus in British Columbia's Fraser Valley. To date, there have been ten infected premises. As part of regular investigation activities, CFIA is fully tracing movements in and out of these sites. This may lead to further premises being identified and depopulated, which would not be unexpected. While there are no reports of H5N2 related illness in humans, as a precautionary measure public health officials are monitoring workers who are exposed to affected poultry. Avian influenza viruses do not pose risks to food safety when poultry and poultry products are properly handled and cooked. Avian influenza rarely affects humans that do not have consistent contact with infected birds. Further information on the outbreak is provided on the following CFIA.

CFIA - Notifiable Avian Influenza

Saturday, October 19, 2013

An Abbreviated FluView


image

# 7876

Although the government shutdown has ended, and the CDC is back in full force, they’ve got some catch-up to do.  So Friday’s FluView report was brief, and accompanied by the following announcement.

image


Flu activity remains low (at least based on the surveillance data we have at the moment), with no pediatric deaths reported, and just one novel (H3N2v) swine variant infection reported in Iowa.


A few excerpts from Friday’s report follow:


2013-2014 Influenza Season Week 41 ending October 12, 2013

All data are preliminary and may change as more reports are received.

This FluView is in the abbreviated format due to the partial government shut-down from October 1-16, 2013.

Synopsis:

During week 41 (October 6-12, 2013), influenza activity remained low in the United States.

  • Viral Surveillance: Of 3,534 specimens tested and reported by U.S. World Health Organization (WHO) and National Respiratory and Enteric Virus Surveillance System (NREVSS) collaborating laboratories during week 41, 166 (4.7%) were positive for influenza.
  • Novel Influenza A Virus: One human infection with a novel influenza A virus was reported.
  • Pneumonia and Influenza Mortality: The proportion of deaths attributed to pneumonia and influenza (P&I) was below the epidemic threshold.
  • Influenza-Associated Pediatric Deaths: No influenza-associated pediatric deaths were reported.
  • Outpatient Illness Surveillance: The proportion of outpatient visits for influenza-like illness (ILI) was 1.1%, below the national baseline of 2.0%. All 10 regions reported ILI below region-specific baseline levels. Two states experienced low ILI activity, 48 states and New York City experienced minimal ILI activity and the District of Columbia had insufficient data.
  • Geographic Spread of Influenza: The geographic spread of influenza in Puerto Rico was reported as regional; 3 states reported local influenza activity; Guam, the District of Columbia, the U.S. Virgin Islands, and 24 states reported sporadic influenza activity; 22 states reported no influenza activity, and one state did not report.

<SNIP>

image

Novel Influenza A Virus

One infection with an influenza A (H3N2) variant virus (H3N2v) was reported to CDC by Iowa. Contact between the case patient and swine in the week preceding illness was reported. The patient has fully recovered and no further cases have been identified in contacts of the case patient. This is the first H3N2v infection reported for the 2013-2014 influenza season, which began on September 29, 2013.

(Continue . . . )


Meanwhile, north of the border, Canada’s FluWatch reports very little influenza activity as well.

image

Monday, March 04, 2013

Flu Activity Week 8: FluView, FluWatch, WISO


image


# 6978


After enduring an early and moderately-severe flu season – one that was dominated by the H3N2 strain - the latest CDC FluView report shows that flu levels are receding, and for the first time this season influenza B has taken the lead.


A pattern similar to that being reported this week in Canada’s FluWatch as well. 


Meanwhile, in Europe where Influenza B has captured roughly half of the flu cases this year, there are signs of decreasing activity as well.


From this week’s FluView Report.


2012-2013 Influenza Season Week 8 ending February 23, 2013

All data are preliminary and may change as more reports are received.

Synopsis:

During week 8 (February 17 - 23, 2013), influenza activity remained elevated in the United States, but decreased in most areas.

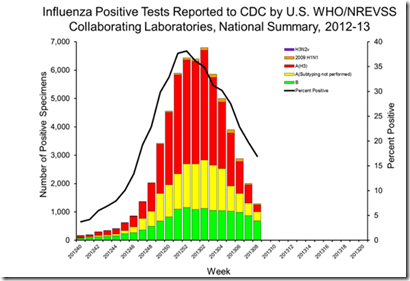
  • Viral Surveillance: Of 7,609 specimens tested and reported by collaborating laboratories, 1,288 (16.9%) were positive for influenza.
  • Pneumonia and Influenza Mortality: The proportion of deaths attributed to pneumonia and influenza (P&I) was above the epidemic threshold.
  • Influenza-Associated Pediatric Deaths: Three pediatric deaths were reported.
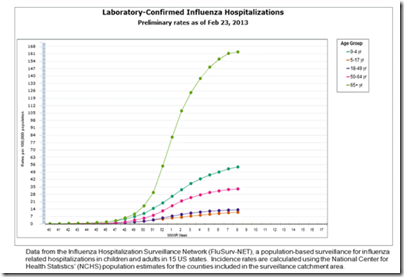
  • Influenza-Associated Hospitalizations: A cumulative rate for the season of 36.7 laboratory-confirmed influenza-associated hospitalizations per 100,000 population was reported. Of reported hospitalizations, over 51% were among adults 65 years and older.
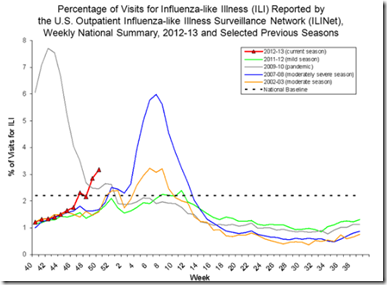
  • Outpatient Illness Surveillance: The proportion of outpatient visits for influenza-like illness (ILI) was 2.7%. This is above the national baseline of 2.2%. Eight of 10 regions reported ILI at or above region-specific baseline levels. Twelve states and New York City experienced moderate activity; 15 states experienced low activity, and 23 states and the District of Columbia experienced minimal activity.
  • Geographic Spread of Influenza: Twelve states reported widespread influenza activity; Puerto Rico and 28 states reported regional influenza activity; 7 states and the District of Columbia reported local influenza activity; 3 states reported sporadic influenza activity; Guam reported no influenza activity, and the U.S. Virgin Islands did not report.

image

Pneumonia and Influenza (P&I) Mortality Surveillance

During week 8, 8.4% of all deaths reported through the 122 Cities Mortality Reporting System were due to P&I. This percentage was above the epidemic threshold of 7.5% for week 8.

Pneumonia And Influenza Mortality


While reports of influenza activity are declining, the rate of hospitalization for lab-confirmed flu in patients over the age of 65 continues at a high level. This H3N2-centric flu season has taken a particularly heavy toll on the elderly.


image


From  Canada, the latest FluWatch Report summation:


FluWatch report: February 17 to February 23, 2013 (Week 8)

Posted 2013-03-01

Overall Summary

  • In week 08, specific indicators of influenza activity continued to decrease, while indicators of the circulation of respiratory viruses such as the ILI consultation rate were similar to recent weeks.
  • The percentage of laboratory detections positive for influenza continues to decrease, while the proportion of positive tests for influenza B has increased in recent weeks. The percentage of laboratory detections positive for RSV and rhinovirus were similar to recent weeks.
  • The number of regions reporting widespread or localized activity was similar in weeks 07 and 08; however, there is an overall decline in influenza/ILI activity from the peak in early January.

image

Last stop is the ECDC, and their WISO (Weekly influenza surveillance overview) report, and flu surveillance infographic.


Main surveillance developments in week 8/2013 (18–24 Feb 2013)

Weekly reporting on influenza surveillance in Europe for the 2012–13 season started in week 40/2012 but active influenza transmission began around week 49/2012, approximately six weeks earlier than in the 2011/2012 season.

  • 19 of 28 countries reporting indicated concomitantly high/medium-intensity transmission and wide geographic spread. Only six countries reported increasing trends compared to eleven in week 7. Fifteen countries have been reporting decreasing or stable trends for at least two consecutive weeks.
  • The proportion of influenza virus-positive specimens from sentinel sites remained high (50%), but it has decreased from the peak (~60%) observed around weeks 5 to 7/2013.
  • Since week 40/2012, an even distribution of influenza virus types has been observed, 50% each for type A and type B viruses. After a sustained increase between weeks 2 and 7/2013, the proportion of A(H1)pdm09 has remained at around 60% of A viruses with subtyping information.
  • 111 hospitalised laboratory-confirmed influenza cases were reported by six countries (Belgium, France, Ireland, Romania, Slovakia, and Spain) with an even distribution of influenza type A and type B viruses.
  • In February 2013, ECDC published its annual risk assessment for seasonal influenza 2012-13 based on data up to week 3/2013.
  • Influenza activity remained substantial in week 8/2013 across Europe but an increasing number of countries reported indications of declining transmission.

image

Saturday, January 12, 2013

Meanwhile, In Canada . . .

image

Credit PHAC FluWatch


# 6849


Yesterday’s FluView report from the CDC showed flu and flu-like-illnesses well entrenched across most of the United States, albeit with activity in some areas down slightly over the week before.  


This year, it has been primarily A/H3N2 causing most of the misery, but two strains of influenza B (Yamagata & Victoria lineage) are circulating as well.


From north of the border, we get PHAC’s weekly FluWatch surveillance, which indicates much the same.  A few excerpts from this week’s report.

image


Overall Influenza Summary

  • Although the percentage of positive laboratory tests for influenza declined slightly in week 01, more regions across Canada reported widespread and localized influenza activity and 107 new influenza outbreaks were reported.
  • A total of 3864 laboratory detections of influenza were reported, of which 98.1% were for influenza A viruses, predominantly A(H3N2).
  • 69 new paediatric influenza-associated hospitalizations were reported through the IMPACT network.
  • 26 new adult influenza-associated hospitalizations were reported through the PCIRN-SOS network.
  • The ILI consultation rate decreased, but is above the expected range for this time of year.

image

Full FluWatch Report

Saturday, January 05, 2013

Canada: FluWatch Week 52

image

Map of overall Influenza activity level by province and territory, Canada, Week 5

# 6826

Like the United States, Canada is reporting increasing levels of influenza across much of their nation, prompting recent headlines such as:

Flu outbreak crowding Canadian emergency rooms

Flu season hitting British Columbians earlier
 
Flu blamed for spike in Calgary emergency room visits
Flu cases nearly triple in Windsor
Flu prompts visitor restrictions at St. John's nursing home

The latest FluWatch report from PHAC combines data from weeks 51 & 52.

Overall Influenza Summary

  • Influenza activity in Canada continues to rise with increases in all indicators in weeks 51 and 52
  • A total of 4632 laboratory detections of influenza were reported, of which 97.7% were for influenza A viruses, predominantly A(H3N2)
  • 127 new influenza outbreaks were reported, 87 of which were in long-term care facilities
  • 114 new paediatric influenza-associated hospitalizations were reported through the IMPACT network, and 176 hospitalizations including 15 deaths among adults ≥20 years of age were reported through Aggregate surveillance
  • The ILI consultation rate increased, but remains within the expected range for this time of year.
  • Similar to previous years, older adults (persons aged ≥65 years) are the most affected this season; with 41.3% of laboratory detections to date, increased outbreaks in long-term care facilities, higher hospitalization rates and a high proportion of antiviral prescriptions among those  ≥75 years.


As the following chart indicates, influenza detections are on the ascendant, and to a lesser extent, so are RSV (Respiratory Syncytial Virus) cases. Rhinovirus, coronavirus, parainfluenza, and metapneumovirus detections – in contrast -  are on the decline.


image


A breakdown of influenza strains identified this year suggest that most are similar to the strains included in this year’s vaccine. That said, we won’t really know how effective this year’s vaccine has been until after the season is over.


Influenza strain characterizations

During the 2012-13 season, the National Microbiology Laboratory (NML) has antigenically characterized 177 influenza viruses [136 A(H3N2), 17 A(H1N1)pdm09 , and 24 influenza B].


The 136 influenza A(H3N2) viruses were antigenically similar to the vaccine strain A/Victoria/361/2011.


The 17 A(H1N1)pdm09  viruses were antigenically similar to the vaccine strain A/California/07/09. Among the influenza B viruses, 20 were antigenically similar to the vaccine strain B/Wisconsin/01/2010 (Yamagata lineage) and four were similar to B/Brisbane/60/2008 (Victoria lineage; component of the 2011-2012 seasonal influenza vaccine) (Figure 6).

image

Figure 6. Influenza strain characterizations, Canada, 2012-2013, N = 177


Note:The recommended components for the 2012-2013 Northern Hemisphere influenza vaccine include: an A/Victoria/361/2011 (H3N2)-like virus; an A/California/7/2009 (H1N1)pdm09-like virus; and a B/Wisconsin/1/2010-like virus.


For more detailed information on the flu, and what Canadians can do to protect themselves, Public Health Canada maintains a specialized influenza website called  FightFlu.ca.


image

Sunday, December 23, 2012

FluView, FluWatch, And WHO Flu Surveillance Reports

image

Week 50 ILI activity – Source CDC FluView


# 6801


Regardless of your preferred type of celebration (Christmas, Hanukah, Kwanzaa, the Winter Solstice, Festivus . . .) the winter holiday season often finds us gathered together in relatively closed quarters to share presents, good times, and far too often . . . germs.


All of which makes this week’s FluView from the CDC, Canada’s FluWatch, and World Health Organization bi-weekly Influenza Summary of particular interest.


The early start to this year’s flu season continues across much of the United States, with A/H3N2 by far the predominate strain being reported. While it is a bit early to talk about the severity of this year’s flu season, historically H3N2 dominated seasons have typically produced more severe illness.


First stop, the CDC’s FluView Report for week 50.


2012-2013 Influenza Season Week 50 ending December 15, 2012

All data are preliminary and may change as more reports are received.

Synopsis:

During week 50 (December 9-15), influenza activity increased in the U.S.

  • Viral Surveillance: Of 9,562 specimens tested and reported by U.S. World Health Organization (WHO) and National Respiratory and Enteric Virus Surveillance System (NREVSS) collaborating laboratories in week 50, 2,709 (28.3%) were positive for influenza.
  • Pneumonia and Influenza Mortality: The proportion of deaths attributed to pneumonia and influenza (P&I) was below the epidemic threshold.
  • Influenza-Associated Pediatric Deaths: Two influenza-associated pediatric deaths were reported. One was associated with an influenza A (H3) virus and one was associated with an influenza A virus for which the subtype was not determined.
  • Outpatient Illness Surveillance: The proportion of outpatient visits for influenza-like illness (ILI) was 3.2%; above the national baseline of 2.2%. Nine of ten regions reported ILI above region-specific baseline levels. Twelve states experienced high ILI activity, New York City and 5 states experienced moderate ILI activity; 11 states experienced low ILI activity; 22 states experienced minimal ILI activity, and the District of Columbia had insufficient data.
  • Geographic Spread of Influenza: Twenty-nine states reported widespread geographic influenza activity; 12 states reported regional activity; the District of Columbia and 5 states reported local activity; 3 states reported sporadic activity; Guam reported no influenza activity, and Puerto Rico, the U.S. Virgin Islands, and 1 state did not report.

A description of surveillance methods is available at: http://www.cdc.gov/flu/weekly/overview.htm


The following graphic shows just how early detection of influenza has been this year (red line), compared to previous years.

image


Meanwhile, Canada’s FluWatch report indicates that influenza is beginning to ramp up in several provinces as well.


image

Overall Influenza Summary

  • Influenza activity in Canada continued to increase in week 50; four regions reported widespread activity, and the majority of regions reported influenza circulation.
  • A total of 1502 laboratory detections of influenza were reported, of which 96.7% were for influenza A viruses, predominantly A(H3N2).
  • Thirty-one influenza outbreaks were reported: 24 in long-term-care facilities, 4 in hospitals and 3 in other facilities.
  • Thirty-three paediatric influenza-associated hospitalizations were reported through the IMPACT network, all but one with influenza A
  • Seventy-three hospitalizations with three deaths in adults ≥20 years of age were reported through Aggregate surveillance, all with influenza A.
  • The ILI consultation rate increased compared to the previous week and is within the expected range for this time of year.


Virus characterization from Canada shows, like the United States, that A/H3N2 makes up the bulk of identified samples.


image


And globally, influenza rates in the Northern Hemisphere are beginning to rise, although many areas are lagging somewhat behind the numbers seen in North America. 


This from the World Health Organization.


Influenza update

21 December 2012 - Update number 175

Summary

• Many countries in the temperate regions of the northern hemisphere are now reporting elevated detections of influenza, particularly in north America.

 
• Influenza activity was still low in Europe, with co-circulating of both influenza A and B viruses. However increased influenza-like illnesses were reported in more countries than previous weeks.


• There was low, but increasing influenza activity in northern Africa and the Eastern Mediterranean regions, and sporadic detections in eastern Asia.

• Influenza in central America, the Caribbean and tropical south America continued to decline, with low levels of circulation of mainly influenza A(H3N2) and some influenza B viruses, except for Cuba and Peru, where influenza A(H1N1)pdm09 was predominant.

• Influenza activity in Sub-Saharan Africa declined to low levels, with mainly influenza B, except in Ghana, where influenza A(H1N1)pdm09 was reported.

• Influenza in most South East Asian countries was declining, except in Sri Lanka and Viet Nam.
• Influenza activity in the temperate countries of the southern hemisphere continued at inter-seasonal levels.


The CDC recommends a flu shot for just about everyone each year, but regardless of whether you received one, this Holiday season is a good time to hone your basic flu hygiene skills.  


The CDC recommends:


Take everyday preventive actions to stop the spread of germs.

  • Cover your nose and mouth with a tissue when you cough or sneeze. Throw the tissue in the trash after you use it.
  • Wash your hands often with soap and water. If soap and water are not available, use an alcohol-based hand rub.*
  • Avoid touching your eyes, nose and mouth. Germs spread this way.
  • Try to avoid close contact with sick people.
  • If you are sick with flu–like illness, CDC recommends that you stay home for at least 24 hours after your fever is gone except to get medical care or for other necessities. (Your fever should be gone without the use of a fever-reducing medicine.)
  • While sick, limit contact with others as much as possible to keep from infecting them.


As an added bonus, these healthy hygiene habits can also help protect you against the other winter time scourge, Norovirus – which, like influenza, can wreck a family holiday gathering in record time.

Saturday, November 10, 2012

Global Flu Surveillance Updates


image


# 6708


After an uncommonly subdued 2011-2012 influenza season (see CDC: The Close Of A Mild Season), and a summer that featured an unprecedented number of variant swine flu infections (see An Increasingly Complex Flu Field) in the United States, no one is quite sure what to expect with the coming flu season.


Invariably, the word most often used by researchers when describing influenza is `unpredictable’.


Nevertheless, in order to come up with a vaccine each year, scientists must decide – 6 months in advance – what flu strains they think will be most active in the season ahead.


After 3 years with essentially no changes, this year’s flu vaccine formulation makes alterations to both the H3N2 and B virus strains.


  • The H1N1 component remains essentially unchanged, with the A/California/7/2009 (H1N1)pdm09-like  still recommended.
  • The old A/Perth/16/2009 (H3N2)-like virus now gives way to the A/Victoria/361/2011 (H3N2)-like virus.
  • And the Victoria lineage B/Brisbane/60/2008-like virus will be replaced by a Yamagata strain; the B/Wisconsin/1/2010-like virus. 


The addition of these two new strains makes getting the vaccine this year all the more important, as community immunity to these recently emerging strains is likely low.


The vaccine die having been cast, each fall we monitor influenza activity around the world via a number of reporting tools, including:


There others, of course.


Hong Kong’s CHP  produces an excellent Weekly Flu Express, and when it’s summer in the Northern Hemisphere we keep a close watch on the Australian  and New Zealand influenza surveillance sites.


Combined, these resources provide us with a pretty good - albeit `backwards looking’ - overview of flu activity. At least in North America, Europe, and parts of the Pacific Rim.


Note: There are plenty of areas around the world where surveillance and reporting are lacking, and so we still run the risk of being blindsided by an emerging influenza strain. 


During flu season I try to provide links, and highlights, to many of these flu surveillance reports each week. For now, flu activity around the world is low, but there are signs it may be increasing. 


From yesterday’s WHO Flu report:


Summary

• Many countries of the Northern Hemisphere temperate region reported increasing detections of influenza viruses, particularly in North America and Western Europe, however none have crossed their seasonal threshold for ILI/ARI consultation rates.
• Several countries in the tropical areas experienced active transmission of influenza virus in recent weeks. In the Americas, Nicaragua and Costa Rica reported mainly influenza B virus detections. In Asia, India, Sri Lanka, Nepal, and Cambodia are all reporting a mixture of all three virus subtypes.
• In Sub-Saharan Africa, Cameroon and Ethiopia have reported an increase in influenza virus detections.
• Influenza activity in the temperate countries of the Southern Hemisphere is at inter-seasonal levels. A review of the 2012 southern hemisphere influenza season was published in the Weekly Epidemiological Record (WER) 2 November 2012, vol. 87, 44 (pp. 421–436)


The ECDC’s latest WISO Report finds very little flu activity across Europe.


Weekly reporting on influenza surveillance for the 2012–13 season started in week 40/2012 in Europe.


•  In week 44/2012, all 26 reporting countries experienced low intensity of clinical influenza activity.
•  Of 279 sentinel specimens tested across 19 countries, only two were positive for influenza virus.
•  No hospitalised laboratory-confirmed influenza cases were reported.


Five weeks into the surveillance season for influenza, there has been no evidence of sustained influenza virus transmission in EU/EEA countries.


The story is pretty much the same in Canada, as we learn from their latest FluWatch Report.


Overall Influenza Summary

  • Influenza activity in Canada increased slightly compared to the previous week; however overall activity still remains fairly low, with most regions of the country reporting no activity.
  • In week 44, a total of 64 laboratory detections of influenza were reported; of which 91% were for influenza A viruses [71% A(H3) and 29% A(un-subtyped)].
  • Six influenza outbreaks in long-term care facilities were reported in week 44.
  • Eleven influenza A-associated hospitalizations were reported in week 44: 8 in adults >20 years of age, and 2 in children.
  • The ILI consultation rate increased in week 44 to 21.9 per 1,000 patient visits but is within the expected level for this time of year. image


In the United States, the CDC’s FluView Reports the beginnings of limited flu activity around the country:

012-2013 Influenza Season Week 44 ending November 3, 2012


image


Synopsis:

During week 44 (October 28-November 3, 2012), influenza activity increased in some areas, but overall was similar to activity last week in the United States.

  • Viral Surveillance: Of 3,277 specimens tested and reported by U.S. World Health Organization (WHO) and National Respiratory and Enteric Virus Surveillance System (NREVSS) collaborating laboratories during week 44, 227 (6.9%) were positive for influenza.
  • Pneumonia and Influenza Mortality: The proportion of deaths attributed to pneumonia and influenza (P&I) was slightly above the epidemic threshold.
  • Influenza-associated Pediatric Deaths: No influenza-associated pediatric deaths were reported.
  • Outpatient Illness Surveillance: The proportion of outpatient visits for influenza-like illness (ILI) was 1.3%, which is below the national baseline of 2.2%. All 10 regions reported ILI below region-specific baseline levels. One state experienced low ILI activity; New York City and 49 states experienced minimal ILI activity, and the District of Columbia had insufficient data.
  • Geographic Spread of Influenza: The geographic spread of influenza in 1 state was reported as regional; 8 states reported local activity; the District of Columbia and 33 states reported sporadic activity; Guam and 8 states reported no influenza activity, and Puerto Rico and the U.S. Virgin Islands did not report.


Many years, influenza doesn’t begin to really spread until December or even January, so the level of activity we are seeing today is probably a poor prognosticator of what we will be seeing two or three months from now.


Influenza, however, is notoriously unpredictable. Which makes each flu season unique, and worthy of our attention.


Stay tuned.

Friday, May 06, 2011

Portrait Of A Flu Season In Decline


# 5542


The CDC , World Health Organization, and PHAC have all released fresh surveillance reports on the rapidly waning 2010-2011 flu season today.


The good news is that influenza in the Northern Hemisphere is all but over for the year.  The bad news is that there are signs that the flu is starting to gather momentum – a bit earlier than usual – in the cooler climes of the Southern Hemisphere.


Of course, influenza and other respiratory viruses continue to circulate during the summer months north of the equator as well, just at greatly reduced levels. 


We’ll look first at the WHO report, followed by excerpts from the Canadian FluWatch and US FluView reports.


Influenza update - 06 May 2011

Update number 133

image

Summary

• Worldwide influenza activity is currently low.


• Influenza activity across the entire temperate Northern Hemisphere is generally back to baseline or pre-seasonal levels


• As levels of influenza activity decrease, influenza type B has become more commonly detected compared to influenza A viruses across the Northern Hemisphere temperate areas and in much of the tropics.


• Transmission in tropical areas of the world is also generally low with some transmission reported in countries of Sub-Saharan Africa with a mixture of viruses and slight predominance of influenza type B.


• In the temperate areas of the southern hemisphere the influenza season has not yet started.


• Nearly all influenza A viruses tested continue to be antigenically similar to those found in the current trivalent vaccine. More than 90% of the influenza type B viruses are also of the lineage found in the vaccine (Victoria lineage); however, a small number of B viruses of the Yamagata lineage are also being reported.


From Canada’s FluWatch (which lags 1 week behind the CDC reports) we get the following synopsis for week 16:


April 17 to 23, 2011 (Week 16)

image

Overall Influenza Summary

  • In week 16, influenza activity in Canada continues to decline.
  • The overall percentage of influenza positive specimens continues to decrease.
  • Fewer regions reported localized influenza activity this week compared to the previous week although slightly more outbreaks were reported, all in the Atlantic provinces.
  • The ILI consultation rate decreased, and both adult and paediatric hospitalizations with influenza were similar to the previous week.


And from the CDC’s FluView Report we get the following excerpts:


2010-2011 Influenza Season Week 17 ending April 30, 2011

image

All data are preliminary and may change as more reports are received.

Synopsis:

During week 17 (April 24-30, 2011), influenza activity in the United States continued to decrease.

  • Of the 1,901 specimens tested by U.S. World Health Organization (WHO) and National Respiratory and Enteric Virus Surveillance System (NREVSS) collaborating laboratories and reported to CDC/Influenza Division, 69 (3.6%) were positive for influenza.
  • The proportion of deaths attributed to pneumonia and influenza (P&I) was below the epidemic threshold.
  • Three influenza-associated pediatric deaths were reported, bringing the season total to 100. One of these deaths was associated with a 2009 influenza A (H1N1) virus, one was associated with an influenza A virus for which the subtype was not determined, and one was associated with an influenza B virus.
  • The proportion of outpatient visits for influenza-like illness (ILI) was 1.3%, which is below the national baseline of 2.5%. All 10 regions reported ILI below region-specific baselines. All 50 states and New York City experienced minimal ILI activity, and the District of Columbia had insufficient data to calculate an ILI activity level.
  • The geographic spread of influenza in two states was reported as regional; the District of Columbia and seven states reported local influenza activity; Puerto Rico and 33 states reported sporadic influenza activity, and the U.S. Virgin Islands, Guam, and eight states reported no influenza activity.


After several months of riding at or above the epidemic threshold, P&I mortality across 122 U.S. Cities has finally dropped below the threshold for week 17.  


P&I mortality is often a `trailing indicator’ as deaths may occur after days or weeks of hospitalization, and reporting may lag by a few weeks.


image


And three more pediatric (under age 18) flu-related fatalities were reported to the CDC, making 100 pediatric deaths since October; slightly more than we’ve seen in non-pandemic flu seasons in recent years.


Influenza-Associated Pediatric Mortality


Numbers, like the 100 pediatric deaths shown above, are likely undercounts. In the coming months researchers will dissect this past flu season and give us a better idea of its impact.  


And while the North American flu season is drawing to a close, the CDC and the vaccine manufacturers are already working on next fall’s flu vaccine.


For more on how vaccine strains are selected, and answers to many common flu vaccine questions, you may wish to visit:


Questions & Answers

Vaccine Selection for the 2011–2012 Influenza Season

Saturday, March 05, 2011

North America Flu Surveillance Week 8


# 5356


Influenza activity across the United States remains elevated, while in Canada it is more of a mixed bag – with parts of Quebec and BC seeing increases while other regions are seeing a decline.

In the US, 14 pediatric deaths were reported, although only 4 of those appeared to have occurred during week 8. 


Other major indicators include the nation’s P&I (pneumonia & influenza) mortality numbers dropped again this week to 8%, which is right at the epidemic threshold for this week -  and ILI consultations dropped to 4%, but still remain well above the national baseline of 2.5%.


First up, the FluWatch report from Canada, followed by the US’s FluView.  Follow the links to read them in their entirety.


image

Summary of FluWatch Findings for the Week ending February 26, 2011

  • In week 08, regions in Quebec and BC reported increases in influenza activity, while other regions across the country reported decreased activity. Many school outbreaks of ILI continue to be reported in New Brunswick. The proportion of positive influenza detections overall continued to decline in week 08, although the ILI consultation rate increased slightly compared to the previous week.
  • Since the beginning of the season, 86.1% of the subtyped positive influenza A specimens have been influenza A/H3N2. In week 08, pandemic H1N1 2009 detections decreased to 7% of positive influenza detections while the proportion of influenza B detections increased to 12%.


Percent positive influenza tests, compared to other respiratory viruses, Canada, by reporting week, 2010-2011

Percent positive influenza tests, compared to other respiratory viruses, Canada, 
by reporting week, 2010-2011


From the CDC, this week’s FluView Report.


2010-2011 Influenza Season Week 8 ending February 26, 2011

image

Synopsis:

During week 8 (February 20-26, 2011), influenza activity in the United States remained elevated.

  • Of the 7,543 specimens tested by U.S. World Health Organization (WHO) and National Respiratory and Enteric Virus Surveillance System (NREVSS) collaborating laboratories and reported to CDC/Influenza Division, 2,106 (27.9%) were positive for influenza.
  • The proportion of deaths attributed to pneumonia and influenza (P&I) was at the epidemic threshold.
  • Fourteen influenza-associated pediatric deaths were reported bringing the season total to 55. Four of these deaths were associated with an influenza B virus, four were associated with a 2009 influenza A (H1N1) virus, two were associated with an influenza A (H3) virus, and four were associated with an influenza A virus for which the subtype was not determined.
  • The proportion of outpatient visits for influenza-like illness (ILI) was 4.0%, which is above the national baseline of 2.5%. All 10 regions reported ILI above region-specific baseline levels. Eighteen states experienced high ILI activity; six states experienced moderate ILI activity; New York City and 16 states experienced low ILI activity; 10 states experienced minimal ILI activity, and the District of Columbia had insufficient data.
  • The geographic spread of influenza in 44 states was reported as widespread; five states reported regional influenza activity; the District of Columbia and one state reported local influenza activity; Puerto Rico and the U.S. Virgin Islands reported sporadic influenza activity, and Guam reported no influenza

U.S. Virologic Surveillance:

WHO and NREVSS collaborating laboratories located in all 50 states and Washington D.C. report to CDC the number of respiratory specimens tested for influenza and the number positive by influenza type and subtype. The results of tests performed during the current week are summarized in the table below.

image

Antigenic Characterization:

CDC has antigenically characterized 1,004 influenza viruses [160 2009 influenza A (H1N1) viruses, 488 influenza A (H3N2) viruses, and 356 influenza B viruses] collected by U.S. laboratories since October 1, 2010.

    2009 Influenza A (H1N1) [160]

  • One hundred fifty-nine (99.4%) of the 160 tested were characterized as A/California/7/2009-like, the influenza A (H1N1) component of the 2010-11 influenza vaccine for the Northern Hemisphere. One virus (0.6%) of the 160 tested showed reduced titers with antiserum produced against A/California/7/2009.

    Influenza A (H3N2) [488]

  • Four hundred eighty-three (99.0%) of the 488 tested were characterized as A/Perth/16/2009-like, the influenza A (H3N2) component of the 2010-11 influenza vaccine for the Northern Hemisphere. Five viruses (1.0%) of the 488 tested showed reduced titers with antiserum produced against A/Perth/16/2009.

    Influenza B (B/Victoria/02/87 and B/Yamagata/16/88 lineages) [356]
    Victoria Lineage [338]

  • Three hundred thirty-eight (94.9%) of the 356 influenza B viruses tested belong to the B/Victoria lineage of viruses.
    • Three hundred thirty-seven (99.7%) of these 338 viruses were characterized as B/Brisbane/60/2008-like, the recommended influenza B component for the 2010-11 Northern Hemisphere influenza vaccine.
    • One (0.3%) of these 338 viruses showed somewhat reduced titers with antisera produced against B/Brisbane/60/2008.

    Yamagata Lineage [18]

  • Eighteen (5.1%) of the 356 viruses were identified as belonging to the B/Yamagata lineage of viruses.

Influenza-Associated Pediatric Mortality

Fourteen influenza-associated pediatric deaths were reported to CDC during week 8. Four of these deaths were associated with an influenza B virus, four were associated with a 2009 influenza A (H1N1) virus, two were associated with an influenza A (H3) virus, and four were associated with an influenza A virus for which the subtype was not determined.

Fifty-five deaths from 25 states (Arizona, Colorado, Florida, Georgia, Hawaii, Illinois, Indiana, Kentucky, Louisiana, Michigan, Minnesota, Nevada, New Jersey, New Mexico, New York, North Carolina, North Dakota, Ohio, Oklahoma, Pennsylvania, Texas, Utah, Virginia, West Virginia, and Wisconsin) and New York City have been reported during this influenza season. Twenty of the 55 deaths reported were associated with influenza B viruses, 12 deaths reported were associated with influenza A (H3) viruses, 12 were associated with 2009 influenza A (H1N1) viruses, and 11 were associated with an influenza A virus for which the subtype was not determined.

Influenza-Associated Pediatric Mortality

Saturday, February 26, 2011

North American Flu Surveillance: Week 7


# 5340


Influenza activity in the United States remains elevated, while in Canada – where levels had been declining for several weeks -  the number of new influenza cases is on the rise again.


A few excerpts from week 7’s data (ending Feb 19th) -pulled from the latest CDC’s FluView and PHAC’s  FluWatch  surveillance reports.


In Canada:


Summary of FluWatch Findings for the Week ending February 19, 2011

  • In week 07, there was an increase in overall influenza activity level, with 62.5% (35/56) of regions reporting localized influenza activity. There was a substantial increase in the number of outbreaks reported this week. The proportion of positive influenza detections overall decreased slightly, though the ILI consultation rate remained similar to the previous week.
  • Since the beginning of the season, 86.3% of the subtyped positive influenza A specimens have been influenza A/H3N2. In week 07, pandemic H1N1 2009 detections increased to 8% of positive influenza detections while the proportion of influenza B detections remained stable at 10%.

image

Overall Influenza Summary – Week 7 (February 13 to February 19, 2011)

In week 07, 35 regions reported localized activity (in all provinces except PE), 15 regions reported sporadic activity (in all provinces and territories except YK) and 6 regions presented no activity (see Activity level Map).

Compared to the previous week (week 06), 15 regions reported an increased level of influenza activity, 5 regions reported decreased activity, and 33 regions maintained a stable level of influenza activity (sporadic or higher).

Fifty-one new ILI/influenza outbreaks were reported: 26 in long-term care facilities (LTCF) in BC(2), SK (5), ON(4), QC(7), NB (2) and NS(6); 20 school outbreaks in AB(2), NB(15), NS(1) and NL(2); 1 hospital outbreak in ON; and 4 outbreaks in other facilities in SK(1), ON(2) and NL(1).


From the CDC, a few excerpts from this week’s FluView report.


2010-2011 Influenza Season Week 7 ending February 19, 2011

image

Synopsis

During week 7 (February 13-19, 2011), influenza activity in the United States remained elevated.

  • Of the 9,154 specimens tested by U.S. World Health Organization (WHO) and National Respiratory and Enteric Virus Surveillance System (NREVSS) collaborating laboratories and reported to CDC/Influenza Division, 2,866 (31.3%) were positive for influenza.
  • The proportion of deaths attributed to pneumonia and influenza (P&I) was above the epidemic threshold for the fourth consecutive week.
  • Six influenza-associated pediatric deaths were reported bringing to season total to 41. Three of these deaths were associated with an influenza B virus, one was associated with an influenza A (H3) virus, one was associated with a 2009 influenza A (H1N1) virus, and one was associated with an influenza A virus for which the subtype was not determined.
  • The proportion of outpatient visits for influenza-like illness (ILI) was 4.9%, which is above the national baseline of 2.5%. All 10 regions reported ILI above region-specific baseline levels. Twenty-one states experienced high ILI activity; six states experienced moderate ILI activity; New York City and 16 states experienced low ILI activity; seven states experienced minimal ILI activity, and the District of Columbia had insufficient data.
  • The geographic spread of influenza in 44 states was reported as widespread; four states reported regional influenza activity; the District of Columbia reported local influenza activity; Puerto Rico, the U.S. Virgin Islands, and two states reported sporadic influenza activity, and Guam reported no influenza activity.

U.S. Virologic Surveillance:

WHO and NREVSS collaborating laboratories located in all 50 states and Washington D.C. report to CDC the number of respiratory specimens tested for influenza and the number positive by influenza type and subtype. The results of tests performed during the current week are summarized in the table below.

image

Pneumonia and Influenza (P&I) Mortality Surveillance

During week 7, 8.3% of all deaths reported through the 122-Cities Mortality Reporting System were due to P&I. This percentage was above the epidemic threshold of 8.0% for week 7 and is the fourth consecutive week in which P&I has been above the epidemic threshold.

Pneumonia And Influenza Mortality

Influenza-Associated Pediatric Mortality

Six influenza-associated pediatric deaths were reported to CDC during week 7. Three of these deaths were associated with an influenza B virus, one was associated with an influenza A (H3) virus, one was associated with a 2009 influenza A (H1N1) virus, and one was associated with an influenza A virus for which the subtype was not determined. Forty-one deaths from 21 states (Arizona, Colorado, Florida, Georgia, Illinois, Indiana, Louisiana, Michigan, Nevada, New Jersey, New Mexico, New York, North Carolina, North Dakota, Oklahoma, Pennsylvania, Texas, Utah, Virginia, West Virginia, and Wisconsin) and New York City have been reported during this influenza season.

Sixteen of the 41 deaths reported were associated with influenza B viruses, 10 deaths reported were associated with influenza A (H3) viruses, eight were associated with 2009 influenza A (H1N1) viruses, and seven were associated with an influenza A virus for which the subtype was not determined.

Influenza-Associated Pediatric Mortality