
# 6978
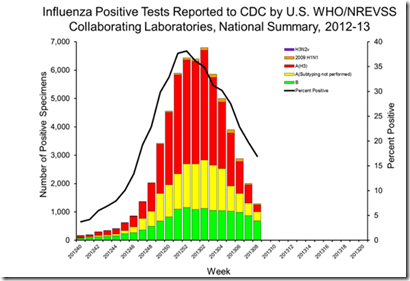
After enduring an early and moderately-severe flu season – one that was dominated by the H3N2 strain - the latest CDC FluView report shows that flu levels are receding, and for the first time this season influenza B has taken the lead.
A pattern similar to that being reported this week in Canada’s FluWatch as well.
Meanwhile, in Europe where Influenza B has captured roughly half of the flu cases this year, there are signs of decreasing activity as well.
From this week’s FluView Report.
2012-2013 Influenza Season Week 8 ending February 23, 2013
All data are preliminary and may change as more reports are received.
Synopsis:
During week 8 (February 17 - 23, 2013), influenza activity remained elevated in the United States, but decreased in most areas.
- Viral Surveillance: Of 7,609 specimens tested and reported by collaborating laboratories, 1,288 (16.9%) were positive for influenza.
- Pneumonia and Influenza Mortality: The proportion of deaths attributed to pneumonia and influenza (P&I) was above the epidemic threshold.
- Influenza-Associated Pediatric Deaths: Three pediatric deaths were reported.
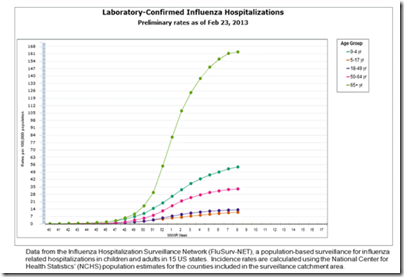
- Influenza-Associated Hospitalizations: A cumulative rate for the season of 36.7 laboratory-confirmed influenza-associated hospitalizations per 100,000 population was reported. Of reported hospitalizations, over 51% were among adults 65 years and older.
- Outpatient Illness Surveillance: The proportion of outpatient visits for influenza-like illness (ILI) was 2.7%. This is above the national baseline of 2.2%. Eight of 10 regions reported ILI at or above region-specific baseline levels. Twelve states and New York City experienced moderate activity; 15 states experienced low activity, and 23 states and the District of Columbia experienced minimal activity.
- Geographic Spread of Influenza: Twelve states reported widespread influenza activity; Puerto Rico and 28 states reported regional influenza activity; 7 states and the District of Columbia reported local influenza activity; 3 states reported sporadic influenza activity; Guam reported no influenza activity, and the U.S. Virgin Islands did not report.
Pneumonia and Influenza (P&I) Mortality Surveillance
During week 8, 8.4% of all deaths reported through the 122 Cities Mortality Reporting System were due to P&I. This percentage was above the epidemic threshold of 7.5% for week 8.

While reports of influenza activity are declining, the rate of hospitalization for lab-confirmed flu in patients over the age of 65 continues at a high level. This H3N2-centric flu season has taken a particularly heavy toll on the elderly.
From Canada, the latest FluWatch Report summation:
FluWatch report: February 17 to February 23, 2013 (Week 8)
Posted 2013-03-01
Overall Summary
- In week 08, specific indicators of influenza activity continued to decrease, while indicators of the circulation of respiratory viruses such as the ILI consultation rate were similar to recent weeks.
- The percentage of laboratory detections positive for influenza continues to decrease, while the proportion of positive tests for influenza B has increased in recent weeks. The percentage of laboratory detections positive for RSV and rhinovirus were similar to recent weeks.
- The number of regions reporting widespread or localized activity was similar in weeks 07 and 08; however, there is an overall decline in influenza/ILI activity from the peak in early January.

Last stop is the ECDC, and their WISO (Weekly influenza surveillance overview) report, and flu surveillance infographic.
Main surveillance developments in week 8/2013 (18–24 Feb 2013)
Weekly reporting on influenza surveillance in Europe for the 2012–13 season started in week 40/2012 but active influenza transmission began around week 49/2012, approximately six weeks earlier than in the 2011/2012 season.
- 19 of 28 countries reporting indicated concomitantly high/medium-intensity transmission and wide geographic spread. Only six countries reported increasing trends compared to eleven in week 7. Fifteen countries have been reporting decreasing or stable trends for at least two consecutive weeks.
- The proportion of influenza virus-positive specimens from sentinel sites remained high (50%), but it has decreased from the peak (~60%) observed around weeks 5 to 7/2013.
- Since week 40/2012, an even distribution of influenza virus types has been observed, 50% each for type A and type B viruses. After a sustained increase between weeks 2 and 7/2013, the proportion of A(H1)pdm09 has remained at around 60% of A viruses with subtyping information.
- 111 hospitalised laboratory-confirmed influenza cases were reported by six countries (Belgium, France, Ireland, Romania, Slovakia, and Spain) with an even distribution of influenza type A and type B viruses.
- In February 2013, ECDC published its annual risk assessment for seasonal influenza 2012-13 based on data up to week 3/2013.
- Influenza activity remained substantial in week 8/2013 across Europe but an increasing number of countries reported indications of declining transmission.


