Showing posts with label Laidback Al. Show all posts

Thursday, January 02, 2014

Referral: A Review of Human Influenza A(H5N1) Cases in 2013

image

H5N1 Virus


# 8122


For several years now, Laidback Al (Editor–Senior Moderator–& Newshound) on FluTrackers – has published  a terrific overview of the previous year’s global H5N1 activity in early January (see H5N1 in 2012: The Year in Review, A Summary Of Worldwide H5N1 Cases in 2011).   Al is well known in Flublogia for  his maps and charts, along with his analysis, and so I’ve featured his work a number of times in the past.


This year, Al has his own blog – called NOVEL INFECTIOUS DISEASES, where he has published his review of H5N1 activity during the year 2013.  You’ll find a permalink on my sidebar to his site.


Follow the link to read:


Wednesday, January 1, 2014

A Review of Human Influenza A(H5N1) Cases in 2013

In 2013, 38 human cases of Influenza A(H5N1)  were reported from around the world. This number represents an 18% increase over the number of reported cases in 2012. Six countries reported cases in 2013, Bangladesh, Cambodia, China, Egypt, Indonesia, and Vietnam. Cambodia reported about 71% (27) of all cases reported in 2013.   In 2013, children younger than 10 years old represent about 63% of all cases. No human clusters were reported in 2013. Relative to other countries, Cambodia experienced the greatest percentage increase in human infections in a short period of time. The continued low frequency of reported infections does not eliminate H5N1 as a pandemic threat. 

(Continue . . . )

Every year I download and convert Al’s analysis to a PDF file which I keep on my desktop as a reference.   This year will be no exception.

Saturday, May 04, 2013

FluTrackers: Preliminary Analysis Of 27 Coronavirus Cases

image

Credit Laidback Al on FluTrackers


# 7228


Laidback Al is back at it on FluTrackers, making it easier for all of us to sort out and keep track of the now-year-long slow emergence of the novel coronavirus on the Arabian peninsula.


He provides maps, details, and commentary in his latest analysis, and it is well worth downloading and keeping as a reference.


Preliminary Overview of 27 NCoV Cases, May 3, 2013

Laidback Al, Senior Moderator, www.FluTrackers.com

A novel betacoronavirus (NCoV) infecting humans was first identified in late of 2012. Through April 15, 2013, a total of 17 cases have been reported from various countries. Incomplete case patient data on the first 17 NCoV cases can be found at this ECDC link.


In the past three days, another 10 cases have been reported, all from Saudi Arabia (FT Link). This discussion presents an over view of the first 27 cases of NCoV. The publicly available information on these cases is limited and sometimes official sources provide conflicting data. The data and discussions presented here are based on the information available as of May 3, 2013.


Quote:


Coronaviruses are a large, diverse group of viruses that affect many animal species. A few of these viruses cause a wide range of respiratory illness in humans, typically with "common cold" symptoms. Genetic sequence data indicate that this new virus is a beta-coronavirus similar to bat coronaviruses, but not similar to any other coronavirus previously described in humans, including the coronavirus that caused severe acute respiratory syndrome (SARS) . . . (link)


This coronavirus is referred to as betacoronavirus 2c EMC2012, but it is also cited in the research literature as HCoV-EMC/2012, NCoV, HCoV, and HCoV-EMC.


“HCoV-EMC/2012 is the sixth coronavirus known to infect humans and the first human virus within betacoronavirus lineage C” (link). As noted by the CDC article this coronavirus shares similarities with bat coronavirus (link). Sequence analysis of fecal specimens of bats in Ghana and Europe led researchers to conclude that EMC/2012 originated from bats (link).

(Continue . . .)


Al, who provides an abundance of charts, graphs and maps on Flutrackers, frequently produces these in-depth overviews. 


Two recent ones well worth revisiting, include:


H7N9: A Demographic and Geographic Overview
H5N1 in 2012: The Year in Review

Monday, April 22, 2013

H7N9: A Demographic and Geographic Overview


# 7176


Regular readers of this blog are already aware of the infectious disease news gathering and analysis that are the daily work product of the volunteers at flu forums like FluTrackers and the Flu WIki.


I’ve written of their work often, most recently in Newshounds On The Trail Of The Latest Beijing H7N9 Report.


One of the creative talents, as senior moderator at FluTrackers is Laidback Al, who produces and updates maps and charts for the site, and from time to time, generates detailed analyses of disease outbreaks. 


As an example, each January Al produces a terrific review of the previous year’s H5N1 cases (see H5N1 in 2012: The Year in Review).


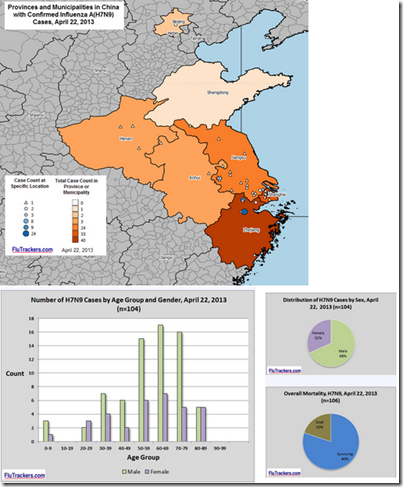
Today Al has produced a new text and graphical report on the first 100 cases in the H7N9 outbreak in China, called:


A Demographic and Geographic Overview of the first 100+ Human Cases of Influenza A(H7N9) in the People’s Republic of China, April 22, 2013


Abstract


A novel influenza virus was discovered infecting humans in mid-February in the People’s Republic of China (China) and was reported publicly on March 31, 2013. This influenza virus, Influenza A (H7N9), has infected more than 100 individuals in China since mid-February. It has not yet been reported outside of China. Among the reported cases, it is virulent with a high mortality rate. Men are twice as likely to contract the virus as women. Most reported cases are elderly individuals. Although limited human-to-human transmission may have occurred among these cases, the reported data does not indicate sustained human-to-human transmission.


Introduction


Since the first official report of human infections of Influenza A(H7N9) in China on March 31, 2013 (link) more than 100 human cases of influenza A(H7N9) have been reported from China to the World Health Organization (WHO) as a reportable disease under International Health Regulations. Data incorporated into this discussion is primarily based on provincial and municipal Departments of Health announcements, official media reports, and updates by WHO. There is no official line list of human cases infected with H7N9 that is publicly available although the Western Pacific Region of WHO published a table of cases that was current through April 17, but has now removed that page from the web.


The information discussed here is based on information compiled by members of FluTrackers.com. FluTrackers (FT) is also maintaining a current numbered list of cases (FluTrackers link). The case numbering sequence used by FluTrackers is based on the date of official report, not onset dates. This list corresponds to the cases reported to WHO by China (WHO archive link), although this discussion includes the asymptomatic 4-year-old boy from Shunyi district, Beijing who tested positive for H7N9 but is not included in the official case count (FT Case Number 61).

image

(Continue . . . )

I’ve just reproduced a small sampling of this report, and I invite you to visit this link to view it in its entirety.

Wednesday, April 10, 2013

Three Graphic Descriptions Of China’s H7N9 Outbreak

image

Credit NIAID


# 7106


One of the hallmarks of the bird flu outbreak in China is how quickly the numbers change. Almost before a news article, blog post, or expert assessment can be created and published, the case count changes.


Still, stopping to examine the cases and trends as they existed 12 or even 24 hours ago has real value. When we look more than just the latest case totals, we can sometimes see patterns that can improve our understanding of an outbreak.


With that in mind, a look at three graphic analyses of the H7N9 outbreak, all based on information that is current as of the last 24 hours.


These charts will undoubtedly be updated and revised as new data comes in, and so they should be checked often.


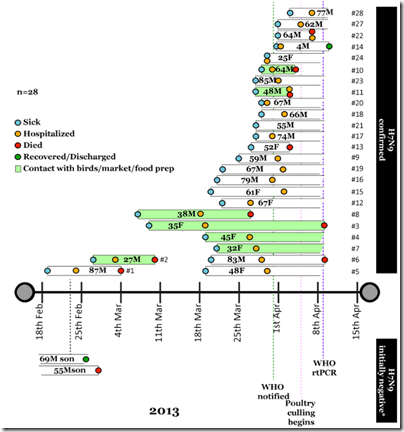
First stop, the terrific timeline chart being maintained by Professor Ian MacKay on the Virus Down Under H7N9 website.


image


After seeing only a couple of cases in January, the number of new cases jumped markedly between March 18th and April 1st. Recent reports indicate new infections continuing into the first week of April.


Be sure to check out the narrative provided on this webpage as well.


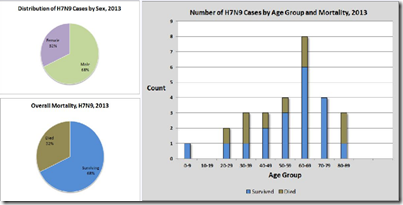
Next stop is a An Overview of Human Cases of H7N9 in China, April 9, 2013, created by Laidback Al on FluTrackers


Al produces a variety of maps and charts at FT, and each January creates a detailed look at the previous year’s Avian flu activity (see H5N1 in 2012: The Year in Review).


Follow this link to view Al’s graphic characterization of China’s H7N9 outbreak.

image


And last stop, the latest Epidemiological Assessment of novel influenza A virus A(H7N9) in China released this morning from the ECDC.


image

image


While these graphs and charts may not provide us with the answers we seek regarding this outbreak, sometimes looking at the data in a fresh way can help us to ask the right kind of questions.


And from there, we may gain a better insight into what this virus is doing, and where this outbreak may be headed.

Tuesday, January 01, 2013

H5N1 in 2012: The Year in Review


# 6815


For several years now, Laidback Al (Editor–Senior Moderator–& Newshound) on FluTrackers – has published  a terrific overview of the previous year’s global H5N1 activity in early January.


You’ll find his 2010, and 2011 summaries here, and here.


Today Al has posted another detailed and highly informative analysis of the past year’s H5N1 human cases (complete with his signature charts & graphs).


This fine piece of work is a `keeper’, and I’ve already saved it to my desktop as a PDF file. I’m sure I’ll refer to it often over the next year or so, as I have with his earlier efforts. 


A few excerpts follow, but use the link and download this entire review.


H5N1 in 2012: The Year in Review

Laidback Al, Senior Moderator, www.FluTrackers.com
January 1, 2013


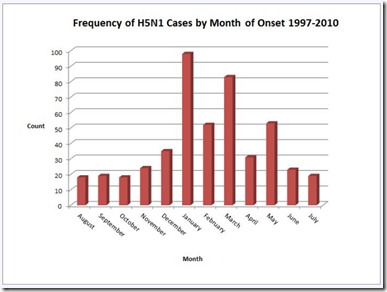
Abstract – In 2012, 32 human cases of H5N1 were reported from around the world, the lowest number of reported human cases since the World Health Organization (WHO) began reporting H5N1 cases in 2003. In 2012, six countries reported cases, Bangladesh, Cambodia, China, Egypt, Indonesia, and Viet Nam. More than 60% of the reported cases died, a slight increase in the fatality rate over 2011. Although there were only 32 cases reported in 2012, five are associated with two clusters. The source of infection for all of the cases has been reported as exposure to sick and dying poultry.


Also, in 2012, controversy over H5N1 laboratory experimentation erupted, several genetic studies were published, and seroprevalence results were evaluated. Although fewer cases were reported in 2012 than preceding years, an H5N1 pandemic is still a potential worldwide public health threat.

Background

Influenza A(H5N1) (often referred to “bird flu” or avian influenza or HPAI) is a novel influenza virus. It was first detected in humans in Hong Kong in 1997. Since 2003, the World Health Organization (WHO) has been monitoring human outbreaks of H5N1, because of its potential to become a pandemic virus. The current WHO report on Human infection with avian influenza A(H5N1) viruses and associated animal health events was updated on December 17, 2012. Through December 31, 2012, WHO has officially reported a total of 610 confirmed human cases of H5N1. The most recent WHO time line of significant events associated with the H5N1 virus was last updated on June 15, 2012 (link).


The following summary of human cases from 2012 is generally organized according to the outlined presented last year in “A Summary of Human H5N1 Cases in 2011”(FT link). Additional discussions of H5N1 topics from 2012 are also presented in this review.

image

(continue . . . )


Highly recommended.

Sunday, January 02, 2011

Referral: A Summary Of 2010 H5N1 Cases


# 5198


Laidback Al (Editor–Senior Moderator–& Newshound) on FluTrackers is perhaps best known for his well rendered maps, charts and graphs illustrating recently posted news items. 


Al also provides level-headed analysis as well.


This morning Al has posted an absolutely terrific overview (complete with his signature charts & graphs) of the H5N1 human infections reported worldwide during 2010. 


This fine piece of work is a `keeper’, and I’ve already saved it to my desktop as a 4 –page PDF file.  I’m sure I’ll refer to it often over the next year or so.


Read:


A Summary of Human H5N1 Cases in 2010


image

(a sample of Al’s handiwork)


Highly recommended.