Showing posts with label Activity. Show all posts

Tuesday, March 10, 2015

Global Influenza Update – March 9th

image


# 9802


Although it has been a heavily H3N2-centric flu season in North America and most of Europe, as the map above shows, portions of Africa and parts of the Middle and Far East have seen a good deal of seasonal H1N1 (aka A(H1N1)pdm09), which continues to be misrepresented in the press in some nations as `swine flu’ or in some cases `bird flu’.


While influenza has peaked across much of the Northern Hemisphere, and is on the decline in North America, some countries are still reporting abundant flu activity.


We continue to see hyperbolic press accounts of India’s H1N1 Outbreak, and almost daily suggestions that something `has changed’ with the virus, but so far no evidence has been presented that the virus has altered either its genetic profile or behavior. 


Meanwhile, the re-formulated flu vaccine for the next Southern Hemisphere flu season  - which includes the `drifted’ H3N2 strain that has caused considerable illness in the Northern Hemisphere this winter – should be available sometime in April.


This from the World Health Organization Global Flu Update.


Influenza update

9 March 2015 - Update number 232, based on data up to 22 February 2015

Summary

Globally, influenza activity remained high in the northern hemisphere with influenza A(H3N2) viruses predominating. Some countries in Africa, Asia and southern part of Europe reported an increased influenza A(H1N1)pdm09 activity.

  • In North America, the influenza activity remained elevated following the influenza peak. Influenza A(H3N2) remained the dominant virus detected this season
  • In Europe, the influenza season was at its height, particularly in central and western countries . Influenza A(H3N2) virus continued to predominate this season.
  • In northern Africa and the middle East, influenza activity was decreasing in most of the region. Influenza A was predominant in the region.
  • In the temperate countries of Asia, influenza activity decreased from its peak in northern China and Mongolia, but continued to increase in the Republic of Korea. Influenza A(H3N2) virus predominated.
  • In tropical countries of the Americas, influenza activity remained low in most countries.
  • In tropical Asia, influenza activity continued to increase in India and Lao People’s Democratic Republic. Influenza activity remained high in southern China, China Hong Kong Special Administrative Region, and the Islamic Republic of Iran.
  • In the southern hemisphere, influenza activity continued at inter-seasonal levels.
  • The vaccine recommendation for the 2015-2016 northern hemisphere winter season was made and can be consulted at the link below:
  • Based on FluNet reporting (as of 5 March 2015 16:25 UTC), during weeks 6 to 7 (8 February 2015 to 21/02/2015), National Influenza Centres (NICs) and other national influenza laboratories from 89 countries, areas or territories reported data for the time period from 8 to 21 February 2015. The WHO GISRS laboratories tested more than 133 895 specimens. 34 056 were positive for influenza viruses, of which 25 455 (74.7%) were typed as influenza A and 8601 (25.3%) as influenza B. Of the sub-typed seasonal influenza A viruses, 2382 (20.5%) were influenza A(H1N1)pdm09 and 9253 (79.5%) were influenza A(H3N2). Of the characterized B viruses, 1656 (97.1%) belonged to the B-Yamagata lineage and 49 (2.9%) to the B-Victoria lineage.


FluNet Summary

9 March 2015

Source: Laboratory confirmed data from the Global Influenza Surveillance and Response System (GISRS).

Based on FluNet reporting (as of 5 March 2015, 16:25 UTC), National Influenza Centres (NICs) and other national influenza laboratories from 89 countries, areas or territories reported data for the time period from 8 to 21 February 2015.a The WHO GISRS laboratories tested more than 133 895 specimens. 34 056 were positive for influenza viruses, of which 25 455 (74.7%) were typed as influenza A and 8601 (25.3%) as influenza B. Of the sub-typed seasonal influenza A viruses, 2382 (20.5%) were influenza A(H1N1)pdm09 and 9253 (79.5%) were influenza A(H3N2). Of the characterized B viruses, 1656 (97.1%) belonged to the B-Yamagata lineage and 49 (2.9%) to the B-Victoria lineage.

Global circulation of influenza viruses
(GISRS-FluNet, snapshot 5 March 2015)

View full size chart
pdf, 359kb
a The time period from 8 to 21 February 2015 corresponds to
  • FluNet / American calendar: weeks 6 and 7
  • International standard ISO 8601: weeks 7 and 8

Wednesday, November 12, 2014

When Influenza Goes Rogue

image

Variability of Flu Seasons - Mash up from Multiple FluView Reports


# 9311


Most people are aware that over the past century we’ve seen 4 influenza pandemics; the 1918 Spanish Flu, the 1957 Asian Flu, 1968 Hong Kong Flu & the 2009 H1N1 pandemic. Of these, the 1918 pandemic was (by far) the worst, but each of the others exacted a heavy toll as well.


Less well known have been the `rogue’ flu years, when we saw something less than a pandemic, but something substantially worse than a typical flu season.


There is, of course, a good deal of variance between `normal’ flu seasons (see chart above), with significant jumps in P&I (Pneumonia & Influenza) mortality registered in the years 2000,  2003 and 2013, while 2012 was the mildest year for influenza in decades.


As a paramedic, I worked the `pseudo-pandemic’ of 1977, and I can attest that it had a big impact, even if it didn’t rise to the level of a global pandemic.  In that case, an old nemesis – H1N1 – which had disappeared 20 years earlier after the arrival of H2N2 in the 1957 pandemic, came back.


While the exact mechanism of that virus’ return isn’t known, the strain was so similar to one last seen in the 1950s that it has been postulated that it was the result of an accidental lab release in China or Russia (see PLoS ONe The Re-Emergence of H1N1 Influenza Virus in 1977 . . . ).  Hence, it was dubbed the `Russian Flu’.


Those over the age of 20 (I made the cut by 3 years), carried some immunity to the old H1N1 virus, but children and adolescents born after 1957 did not, and so they were the most susceptible to infection.  Emergency rooms were slammed, and while the impact was limited and most patients recovered, in some people’s books 1977 qualifies as a `pseudo-pandemic’ year . . . at least for kids.


H1N1’s impact went far beyond just what happened in 1977, for for the first time in our limited knowledge of influenza strains, we ended up having two seasonal influenza A strains in co-circulation; H3N2 and H1N1. Something that previously, had never been observed.


Another, less well remembered event, was the `Liverpool Flu’ of 1951, which for awhile, killed at a greater rate than did the Great Influenza of 1918.


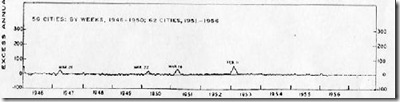
For most of the world, 1951 was an average flu year.  The dominant strain of influenza that year was the so-called `Scandinavian strain', which produced mild illness in most of its victims. In fact, if you look at a graph of flu activity for the United States, running from 1945 to 1956, you'll see nary a blip.

1946-1956


But in December of 1950 a new strain of virulent influenza appeared in Liverpool, England, and by the end of the flu season, had spread across much of England, Wales, and Canada. This from an absolutely fascinating EID Journal article: Viboud C, Tam T, Fleming D, Miller MA, Simonsen L. 1951 influenza epidemic, England and Wales, Canada, and the United States.


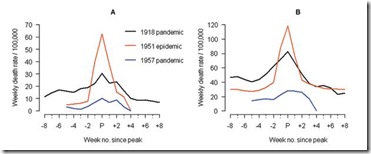
The 1951 influenza epidemic (A/H1N1) caused an unusually high death toll in England; in particular, weekly deaths in Liverpool even surpassed those of the 1918 pandemic. . . . . Why this epidemic was so severe in some areas but not others remains unknown and highlights major gaps in our understanding of interpandemic influenza.


According to this study, the effects on the city of origin, Liverpool, were horrendous.


In Liverpool, where the epidemic was said to originate, it was "the cause of the highest weekly death toll, apart from aerial bombardment, in the city's vital statistics records, since the great cholera epidemic of 1849" (5). This weekly death toll even surpassed that of the 1918 influenza pandemic (Figure 1)

liverpool


This extraordinary graph shows the excess deaths in Liverpool during this outbreak (red line),  while the black line shows the peak deaths during the 1918 pandemic.  This chart shows excess deaths by   A) respiratory causes (pneumonia, influenza and bronchitis) and B) all causes.


For roughly 5 weeks Liverpool saw an incredible spike in deaths due to this new influenza.   And it didn’t remain localized.  While it appears not to have spread as easily as the dominant Scandinavian strain, it managed to infect large areas of England, Wales, and Canada over the ensuing months.


Getting started relatively late in the flu season, this new strain never managed to spread much beyond UK and Eastern Canada.  Nor did it reappear the next flu season.  It vanished as mysteriously as it appeared.


Another example, but one that affected the transmissibility and not the virulence of the seasonal virus, occurred in 1947.  The so-called `vaccine failure’ year, when a new H1N1 virus swept quickly around the world.


In 1947 a new variant of the H1N1 virus appeared on military bases – first noticed in Japan – and quickly spread from there. While it produced a generally mild illness there were apparently low levels of immunity in the population (see EID Journal Influenza Pandemics of the 20th Century).  1947 is little remembered today, except by epidemiologists, because while widespread, this new flu strain produced few excess deaths.

.

And then there were the epidemics that might have been – but that for reasons unknown – didn’t happen.


In early 1976, after an absence of nearly two decades, a never-before-seen strain of H1N1 swine flu appeared at Ft. Dix, New Jersey – prompting a national emergency response for its expected return in the fall.  While that failed to happen (see Deja Flu, All Over Again), the following year we were blindsided by the `Russian’ H1N1 flu described above.


Why the 1976 H1N1 Swine flu fizzled out remains a mystery.


As we go into each year’s flu season, we are always presented with a  `Forrest Gump’ moment. We never quite know what we are going to get.


But we do know that even in a non-pandemic year, we can see tens of thousands of American lives lost due to influenza. Globally, we are talking hundreds of thousands. And that a season can start off mild and unassuming (like 1950) and end up as a raging epidemic. 


We also know that a flu season can affect different parts of the world differently.  We may very well see an H3N2-centric flu season this year in North America, but in Europe or Asia, they could easily see H1N1 instead.


While every year is a question mark, this year we have a number of additional variables at play. The first comes from the rise in the number of antigenically diverse H3N2 clades being reported around the world (see ECDC: Influenza Characterization – Sept 2014). 


Since this fall’s vaccine strains were selected last February, the `balance of power’ among flu H3N2 flu strains has begun to shift, and the H3N2 component for next year’s Southern Hemisphere flu shot has already been changed to meet the challenge of an emerging A/Switzerland/9715293/2013 (H3N2)-like virus


Complicating matters, last week it was announced that last year’s LAIV (Live Attenuated Influenza Vaccine)  –  aka FluMist nasal spray vaccinewas not effective against the H1N1(pdm) virus in children aged 2-8, and that it is likely to be ineffective this year as well.


And if all of this isn’t enough uncertainty, this year we are watching more novel flu strains than ever before;  H7N9, H5N1, H5N6, H5N2, H5N8, H5N3, H9N2 and H10N8 just to mention the biggest concerns.  You’ll find an excellent overview of these emerging avian flu threats in this weeks’ FAO-EMPRES Report On The Emergence And Threat Of H5N6.


As I’ve written here often , flu vaccines are considered very safe – and most years provide a moderate level of protection against influenza. While there are some questions regarding this year’s vaccine `match’ with circulating strains, some protection beats no protection any day of the week.


While the vaccine can’t promise 100% protection, it – along with practicing good flu hygiene (washing hands, covering coughs, & staying home if sick) – remains your best strategy for avoiding the flu (and other viruses) this winter.


Meanwhile, we have what is shaping up to be a fascinating year for studying all types of flu viruses. 

Thursday, January 03, 2013

HPA: Flu Activity In The UK


# 6820


While the United States and Canada have reported an early start to the flu season this year, influenza has yet to take off in Hong Kong (see latest Flu Express (Week 52, 2012), and in the UK and parts of Europe the flu season is just now starting to pick up. 


image

The RED LINE indicates this year’s activity, compared to previous years.  The Blue Line indicates the unusually severe 1999-2000 flu season.


This latest flu updates from the HPA.


HPA National Influenza Report

Report published 3 January 2013

Figures (including all those found in this report) displaying data from these schemes are available to download as a pdf file:

HPA Weekly National Influenza Graphs (PDF, 713 KB)

PDF versions of previous reports are available on the archive page.

This week's report is available as a pdf:

HPA National Influenza Report - week 1 (2013) (PDF, 665 KB)

A summary report will be published weekly. For further information on the surveillance schemes mentioned in this report, please see the Sources of UK Flu Data page.

Increases continue to be seen for several indicators of influenza activity. A letter has been issued to the NHS that GPs may now prescribe antiviral medicines for the prophylaxis and treatment of influenza in accordance with NICE guidance.


Flu activity update: 3 January 2013

3 January 2013

Latest figures from the Health Protection Agency (HPA) up to 30 December 2012 show that flu activity continues to increase based on a number of indicators, including GP consultation rates in England and the proportion of calls to NHS Direct.


The latest figures show that GP consultation rates have increased slightly from 27.4 per 100,000 in week 51 to 32.7 per 100,000 in week 52 ending on 30 December. Meanwhile, 2.1% of the calls received by NHS Direct concerned influenza compared to 1.6% in week 51.


Professor John Watson, head of the respiratory disease department at the HPA said:


“Over the Christmas period we have seen a slight rise in flu activity across several of our indicators in line with the trend we expect to see at this time of year.


“However, the latest data should be interpreted with caution due to GP practices being closed on the bank holidays which may have impacted on GP consultation rates.

(Continue . . . )


Elsewhere in Europe, the most recent EuroFlu report states:


Influenza activity is increasing slowly in the WHO European Region

Summary, week 51/2012

Influenza activity is slowly increasing with more countries in different parts of the Region reporting sporadic co-circulation of influenza A(H1N1)pdm09, A(H3N2) and type B viruses. This week the reporting of influenza surveillance data is incomplete due to the Christmas holidays. This is reflected in the lower number of testing performed. However the percentage of influenza-positive samples from both sentinel and non-sentinel sources are similar to last week. The number of reported hospitalizations due to severe acute respiratory infection (SARI) remains similar to that seen in the previous several weeks: 1 influenza detection was reported (influenza B).

Wednesday, January 02, 2013

Flu Reports From Around The Nation

image

Credit CDC FluView 


# 6818


While a few states are still reporting low influenza activity, much of the nation has reported significant increases in influenza-like-illnesses during the month of December. Of concern, the predominate strain this year has been H3N2, which tends to produce a more severe season than does H1N1.


With the holidays over and schools scheduled to return to session this week and next, many communities are bracing for another spike in flu cases.


A brief round up today of some of the news reports of Flu Activity around the country.


First stop, Minnesota, where the latest CDC FluView report showed only moderate activity as of the 22nd of last month.


Flu cases spike in Minnesota

The Associated Press

MINNEAPOLIS —

Health officials predict it could be one of the worst flu seasons in years in Minnesota.


Flu patients have been filling urgent care centers and emergency rooms across the state. More than 120 Minnesotans were hospitalized with the flu in the week ending Dec. 22, nearly twice the number of cases in the previous week, health officials said. And it's still early in the flu season.


"That suggests this has the potential to be severe," said Minnesota Department of Health infectious disease director Kris Ehresmann.

(Continue . . . )


From Florida, Sharon Sanders, editor of  FluTrackers, has been in contact with the local health department, and files this report:


Influenza Trends Up in Central Florida in December


Sharon Sanders - Editor FluTrackers.com
January 2, 2012


Winter Park, Florida – Reports from sentinel providers indicate that influenza and influenza-like-illness have been trending up since Thanksgiving says Dain Weister who is the Florida Department of Health spokesman for Orange and Seminole counties. “We are reaching the level of activity seen in the 2009 pandemic” he said. Figure 1 on the Florida Flu Review for week 52 in 2010 shows the progression of the 2007-2008, 2008-2009, and 2009-2010 Florida influenza seasons as monitored by three surveillance systems: ILINet, Bureau of Laboratories viral surveillance, and county activity levels.


The Florida Department of Health    indicates "Moderate” as the current level of influenza activity in Central Florida on its website (see map 2).

image

Mr. Weister reported that 2 nursing homes in the Central Florida area have experienced a flu outbreak this season. Most hospitalizations have been in the 55+ age group and most emergency room visits for flu symptoms have been in the 0-19 age range.


The prevalent influenza type in the area confirmed by laboratory testing is A/H3 and A/H1N1 (H1N1pdm09) has also caused some illness. Mr. Weister can reached at 407-858-1400 for further inquiries.


From Arizona, we get:


Cases of flu in AZ, across US already signal busy season

All but two Arizona counties have reported cases of the flu in what is turning out to be an early and busy season.


A total of 581 flu cases of the flu have been laboratory confirmed by the Arizona Department of Health Services this season, state data show. At this time last year only 10 cases had been confirmed statewide.

(Continue . . .)


And this report (with video from WKYC-TV) from Ohio indicates a 13-fold increase in flu cases this year, over last.


Ohio flu season sees rise in hospitalizations

CLEVELAND -- The Ohio Department of Health is reporting a spike in the number of people hospitalized with influenza this year compared to last year.


Department spokeswoman Shannon Libby says it's early to see this much flu activity, with cases typically going up in January or February.


According to ODH influenza reports, 65 Ohioans were hospitalized with the influenza virus from October to late December 2011. In that same period this year, the number skyrocketed to 867.

(Continue . . . )


A reminder that there are still plenty of places where you can get a flu shot, and since the peak of the season may still be a month or more away, it isn’t too late to do so.


In addition to the shot, the CDC recommends:


Take everyday preventive actions to stop the spread of germs.

  • Cover your nose and mouth with a tissue when you cough or sneeze. Throw the tissue in the trash after you use it.
  • Wash your hands often with soap and water. If soap and water are not available, use an alcohol-based hand rub.*
  • Avoid touching your eyes, nose and mouth. Germs spread this way.
  • Try to avoid close contact with sick people.
  • If you are sick with flu–like illness, CDC recommends that you stay home for at least 24 hours after your fever is gone except to get medical care or for other necessities. (Your fever should be gone without the use of a fever-reducing medicine.)
  • While sick, limit contact with others as much as possible to keep from infecting them.


These precautionary steps can also help protect against norovirus, which is spreading misery this winter as well -although Hand Sanitizers May Be `Suboptimal’ For Preventing Norovirus.

Tuesday, May 29, 2012

Hong Kong: Flu Activity Continues To Rise


# 6354


Normally by the end of May influenza activity in the Northern Hemisphere has returned to summer background levels, and our focus turns to the Southern Hemisphere’s flu season. 


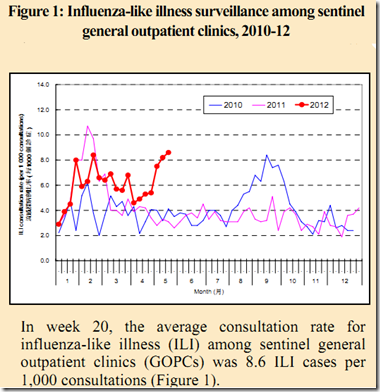
Last week the May 24th edition of Hong Kong’s Flu Express indicated that influenza activity continues at unusually high levels for this time of year.


image


According to a Hong Kong Centre For Health Protection press release today, influenza activity continues to rise in their city, and a general caution has been issued.


29 May 2012

Influenza activity reaches highest level this year 

The Centre for Health Protection (CHP) of the Department of Health today (May 29) called on the public to maintain vigilance against seasonal influenza as the latest surveillance data shows that local influenza activity is at its highest level this year.


The Public Health Laboratory Centre (PHLC) of the CHP has detected a further increase in the number of influenza detections. The weekly number of influenza detections at the PHLC increased from 329 in the week ending May 5 to 1,113 in the week ending May 26, the highest number recorded so far this year. The number of institutional influenza-like illness (ILI) outbreaks increased from 16 to 64 during the same period. The current circulating influenza virus strain is influenza A(H3N2) virus, accounting for more than 95 per cent of all the influenza detections in the past four weeks.


From January 13 to noon on May 28, there were 214 cases (including 128 deaths), with ICU admissions or deaths with laboratory-confirmed influenza recorded by the enhanced surveillance system set up by CHP with the Hospital Authority and private hospitals to monitor the severity of influenza activity during influenza peak seasons. Fourteen paediatric cases (including two deaths) with severe influenza-associated complications or deaths have been recorded this year (as of May 28).  Compared with the winter flu season in the first quarter of 2011, the 2012 flu season has caused a higher proportion of serious/fatal cases among elderly people aged 65 years or above, and a lower proportion of serious/fatal cases among children aged below 5 years.

A spokesperson for the CHP said, "Influenza activity is expected to stay high for some weeks to come, and we will continue to see some serious/fatal cases among all age groups, especially the elderly."

(Continue . . . )


According to last week’s Flu Express, the predominant flu strain (by far) was H3:


In week 20,  the number of influenza viruses
detected in the Public Health Laboratory Centre was 852, including 827 influenza A (H3) viruses, 22
influenza B viruses, 2 influenza A(H1N1)2009
viruses and 1 influenza A virus (Figure 3).


Although the flu season across Europe and the Americas was late in starting, and short in duration, there were signs that the seasonal H3N2 virus circulating had drifted antigenically – prompting a change in the formulation of this fall’s flu vaccine.


It will be interesting to see if further analysis reveals any antigenic changes in the H3 virus circulating in Hong Kong, and how closely they match with the new vaccine strain (A/Victoria/361/2011 (H3N2)-like virus).

Monday, January 02, 2012

Referral: A Summary Of Worldwide H5N1 Cases in 2011


# 6048


One of the senior moderators at FluTrackers, who goes by the moniker Laidback Al, has put together an impressive overview of human H5N1 cases reported during the year just past.


Al, who is well known at FluTrackers for his skill with maps and charts, uses visual representations of the data to good effect here.


I’ve posted just a snippet from the abstract and smaller versions of a couple of his graphics below, but I encourage everyone to go to the thread and read it in its entirety.


This is as fine of an overview of the situation as you are apt to find anywhere, and I’ve already downloaded a copy and put in into the reference folder on my desktop.


It’s a keeper, and highly recommended.


A Summary of Worldwide Human H5N1 Cases in 2011


Laidback Al, Senior Moderator, www.FluTrackers.com
January 1, 2012


Abstract – In 2011, 59 human cases of H5N1 were reported from around the world, a 23% increase over 2010. Five countries reported cases in 2011, Bangladesh, Cambodia, China, Egypt, and Indonesia. Almost half of the 59 cases (about 45%) were children under 10 years old. The fatality rate did not appreciably decline in 2011, about half of all the reported cases died. Four small family clusters were noted during the year. The source of exposure for all of the cluster cases has been reported as exposure to sick and dying poultry. None of these clusters resulted in sustained human to human transmission. Based on an analysis of the 2011 data, the potential for a virulent H5N1 pandemic has not diminished.

image


image

(Continue . . . )

Sunday, October 24, 2010

CDC: FluView & Global Flu Activity


# 5006


The 2010-11 influenza season hasn’t ramped up yet in the northern hemisphere, and so there is still time to get a flu shot and start building antibodies before you are apt to be exposed.


This year - in addition to the likely return of H1N1 - we’ve a new (Perth) strain of the H3N2 virus against which many are likely to have only limited immunity.


When H3 viruses dominate – unlike their H1N1 cousins – they generally produce more severe flu seasons and often impact senior citizens harshly.


Internationally, we are seeing a good deal of H3N2 around the world, and in some areas it is the dominant strain.  


First a look at the latest International flu report (note: this data is from weeks 38-39), then this week’s FluView report from the CDC.


The RED slices of the pie chart indicated H3N2, while ORANGE indicates H1N1.   Yellow is Untyped influenza A.


image


Influenza activity in most areas of the southern hemisphere peaked several weeks ago, and is now on the decline.


Seasonal Flu: International Situation Update

October 20, 2010, 11:00 AM ET

Global Flu Activity Update, October 19, 2010

The following summary of key influenza-related updates was created from regional World Health Organization (WHO) reports, country reports, CDC field staff updates, and other sources. Updates are listed by region and focus on data collected during epidemiologic weeks 37 through 40 (September 12 – October 9, 2010). Northern Temperate

Europe

In week 40, influenza activity intensity was low in all reporting European countries (20 countries), according to the European Centre for Disease Prevention and Control. Nineteen countries collected sentinel respiratory specimens in week 40, and 2 out of 161 specimens (1.2%) were influenza-positive.

Canada

ILI consultation rates in weeks 38 and 40 are at baseline levels and below the level reported in 2009, according to the Public Health Agency of Canada.


You can access the current, and historical Fluview  influenza activity reports at this link with weekly reports going back more than a decade.

image


2010-2011 Influenza Season Week 41 ending October 16, 2010

All data are preliminary and may change as more reports are received.

Synopsis:

During week 41 (October 10-16, 2010), influenza activity remained low in the United States.

  • Ninety-two (3.6%) specimens tested by U.S. World Health Organization (WHO) and National Respiratory and Enteric Virus Surveillance System (NREVSS) collaborating laboratories and reported to CDC/Influenza Division were positive for influenza.
  • The proportion of deaths attributed to pneumonia and influenza (P&I) was below the epidemic threshold.
  • No influenza-associated pediatric deaths were reported.
  • The proportion of outpatient visits for influenza-like illness (ILI) was below the national baseline. All 10 regions reported ILI below region-specific baseline levels and all 49 states with sufficient data experienced minimal ILI activity.
  • Geographic spread of influenza in the District of Columbia, Puerto Rico, and 24 states was assessed as sporadic, Guam and 26 states reported no influenza activity and the U.S. Virgin Islands did not report.

image

Pneumonia and Influenza (P&I) Mortality Surveillance

During week 41, 6.5% of all deaths reported through the 122-Cities Mortality Reporting System were due to P&I. This percentage was below the epidemic threshold of 6.6% for week 41.

Pneumonia And Influenza Mortality

Saturday, June 05, 2010

Transitions: 3 Global Snapshots Of Flu Activity


# 4625


Last week marked the end of the traditional flu season in the Northern hemisphere (although some flu continues to circulate) and the flu season south of the equator has not yet moved into full swing.


For now, during this transition period, flu activity around the world is at relatively low levels. 


But that is not to say there isn’t anything interesting going on, as the following three graphics from the World Health Organization attest.   


Note: These maps reflect data collected between weeks 18 and 20 (May 3rd – May 22nd).


image

This first graphic shows, as we might expect, that respiratory disease activity is either declining or unchanged north of the equator, and is on the rise in Brazil, Australia, and New Zealand.


image


The second image shows the geographic spread of influenza activity.  While much of the world (including all of Africa, Canada, much of the middle east, and China) did not report numbers for week 18, the two hotspots for flu activity at that time appear to be the Dominican Republic and New Zealand.


I’ve saved the most interesting for last.


This third image shows the type of influenza being detected around the world. While Influenza B continues to reign in Russia and China, seasonal H3N1  H3N2 (thanks to Ian York for pointing out my fumble-fingered typo!) continues to circulate in eastern Africa. 


image


Almost everywhere else in the world, pre-pandemic seasonal influenza has all but disappeared.  Whether that will happen in Africa, or whether H3 still has `legs’, is something we will simply have to wait to see.


While the CDC has stopped their weekly FluView reports for the summer, we still have these WHO updates.   So over the next few months we’ll keep monitoring these maps to see what trends may be developing.