Showing posts with label USGS. Show all posts

Friday, April 03, 2015

USGS: Genetic Analysis Of North American Reassortant H5N1 Virus From Washington State

image

How viruses shuffle their genes (reassort)


# 9896


Last fall, when the recently emerged Asian H5N8 avian flu virus arrived in North America (presumably via migratory birds), it encountered a wide range of North American avian influenza viruses that circulate in native species.  As avian viruses are sometimes wont to do - they simultaneously inhabited a number of hosts - and through reassortment produced at least a couple of hybrid viruses.


The reassortment that has done the best so far has been HPAI H5N2, which has now spread to at least 13 states, and has been plaguing commercial turkey operations across the Midwest (see APHIS: H5N2 Confirmed In South Dakota, 4th Farm Hit In Minnesota).


In January, in OIE: New Reassortant HPAI H5N1 In North America, we learned that an HPAI H5N1 subtype had also been generated, which was discovered in an an American green-winged teal in Whatcom County, Washington.   Three weeks later a similar virus was detected in a backyard flock in British Columbia (see  OIE Notification On Canadian H5N1 Detection).


While sharing the same subtype identifier (H5N1) with  the infamous – and often deadly – Eurasian H5N1 virus, this was a new reassortant that carried some – but not all – of the Eurasian avian H5N1 genes, mixed with genetic contributions from North American (AM) avian viruses. 


In other words, a new version of H5N1.


The good news is, that unlike its Eurasian cousin, we’ve seen no evidence that this version of H5N1 is pathogenic to humans.  Human exposure has likely been limited and the virus continues to evolve, so the CDC has cautiously advised:


The appearance of newly detected avian influenza A H5 viruses in North America may increase the likelihood of human infection with these viruses in the United States. Because these newly identified avian influenza A H5 viruses are related to avian influenza A viruses associated with severe disease in humans (e.g., highly pathogenic Asian-lineage avian influenza A (H5N1) virus), they should be regarded as having the potential to cause severe disease in humans until shown otherwise


Yesterday the journal Genome Announcements published a genetic analysis of this first North American H5N1 reassortant, produced by the USDA and the USGS.   First a link, and some excerpts from the study, followed by a USGS press release, after which I’ll return with a little more:


Novel H5 Clade 2.3.4.4 Reassortant (H5N1) Virus from a Green-Winged Teal in Washington, USA

Mia Kim Torchettia, Mary Lea Killiana, Robert J. Dusekb, Janice C. Pedersena, Nichole Hinesa, Barbara Bodensteinb, C. LeAnn Whiteb, Hon S. Ipb

ABSTRACT

Eurasian (EA)-origin H5N8 clade 2.3.4.4 avian influenza viruses were first detected in North America during December 2014. Subsequent reassortment with North American (AM) low-pathogenic wild-bird-origin avian influenza has generated at least two reassortants, including an EA/AM H5N1 from an apparently healthy wild green-winged teal, suggesting continued ongoing reassortment.

GENOME ANNOUNCEMENT

(EXCERPT)

This novel EA/AM H5N1 reassortant virus contains 4 EA H5N8 and 4 AM-origin RNA segments. The Eurasian polymerase basic 2 (PB2), hemagglutinin (HA), nucleoprotein (NP), and matrix (MA) genes have the closest similarities (99%) to those of the A/gyrfalcon/Washington/41088-6/2014 (H5N8) and A/crane/Kagoshima/KU1/2014 (H5N8) viruses from Japan. The hemagglutinin protein has a multibasic protease cleavage site sequence of PLRERRRKR/GLF that is characteristic of the HPAIV H5 clade 2.3.4 (5). The 4 AM low-pathogenic wild-bird-lineage segments have 99% similarities to the AM AIV segments of wild-bird origin, as follows: PB1, A/bufflehead/California/3118/2011 (H4N8); polymerase acidic (PA), A/American green-winged teal/Wisconsin/11OS3425/2011 (H12N5); neuraminidase (NA), A/blue-winged teal/Texas/AI12-909/2012 (H7N1); and nonstructural (NS), A/northern shoveler/California/HKWF392sm/2007 (H10N7).

Earlier in 2014, the EA-H5N8 HPAIV circulating in South Korea was found to have diverged into two groups (A and B) (6). The group A viruses have now been detected across multiple countries, with evidence of regional diversification (intercontinental group A, subgroups 1 to 3 [icA1-3; D. Lee, M. Torchetti, K. Winkler, H. Ip, C. Song, D. Swayne, unpublished data]). Two icA2 reassortant viruses (EA/AM H5N2 and EA/AM H5N1) have now been detected in Washington; however, no reassortants have been detected to date in any of the other icA subgroups.

The introduction of the icA2-H5 clade 2.3.4.4 virus initially into the Pacific Flyway in 2014 with subsequent detection of at least two reassortants with North American low-pathogenic AIV by early 2015 suggests the potential for further reassortment events as the icA2-H5 viruses continue to circulate among wild birds. Further work to monitor for such reassortments and an evaluation of these viruses are warranted. During the preparation of this paper, a nearly identical H5N1 virus was found in a backyard flock in Chilliwack, BC, Canada.

Nucleotide sequence accession numbers.The genome sequence of A/American green-winged teal/Washington/195750/2014 (H5N1) virus is deposited in GenBank under accession numbers KP739418 to KP739425.


Circulation of Highly Pathogenic Avian Flu in North American Birds


Viral Changes Make Current Situation More Complex
Released: 4/2/2015 11:45:00 AM

Highly pathogenic avian influenza (HPAI) H5 viruses of Eurasian origin continue to circulate and evolve in North American wild birds.

The U.S. Geological Survey and U.S. Department of Agriculture published the genetic analysis of a mixed-origin HPAI H5N1 avian flu virus in the journal Genome Announcements today. This novel virus was discovered in a green-winged teal in Washington State that was sampled at the end of 2014. It is a mixed-origin virus containing genes from the Eurasian HPAI H5N8 and genes from North American low pathogenic avian influenza from wild birds. This H5N1 virus is different from the well-known Asian H5N1 HPAI virus that emerged in 1996.

This new publication follows a recent article describing the introduction of Eurasian HPAI H5N8 into North America at the end of 2014 and the detection of a different mixed-origin virus (HPAI H5N2) in wild birds. In March 2015, the HPAI H5N2 virus was detected in commercial turkey flocks in Minnesota, Missouri and Arkansas, in a backyard flock of mixed poultry in Kansas and in a wild bird in Wyoming.

“Such findings are not unexpected and might continue as the Eurasian lineage H5 circulates in the United States,” said co-author Mia Kim Torchetti, a USDA Animal and Plant Inspection Service scientist.

<SNIP>

Each mixed-origin virus might carry different risks and surveillance of circulating HPAI viruses is ongoing. The USGS and USDA scientists continue to monitor Eurasian H5 lineage viruses and provide stakeholders with timely information for management purposes.


The most recent Wild Bird Findings confirmed by USDA’s National Veterinary Services Laboratories (dated 3/27/2015) list 50 detections of HPAI H5 viruses across a dozen western states, and this tally continues to grow. 


It is likely that these viruses are already present in more states than surveillance has revealed, and that their geographic range will continue to expand. AS that happens they are likely to encounter additional native avian flu subtypes, and new opportunities for reassortment may occur. 


For now, all of this is primarily a concern for the nation’s poultry farmers - but novel influenza viruses are spectacularly unpredictable - and so we watch these developments with considerable interest.

Wednesday, April 01, 2015

USGS: Alaska - A Hotspot For Eurasian Avian Flu Introductions

image


# 9891


Although the arrival of HPAI H5 viruses of Eurasian origin to North America this winter was met with surprise, it wasn’t a completely unexpected event.  For years we’ve watched as the USGS and  the U.S. Fish and Wildlife Service in Alaska have worked to test and track bird migrations and the avian influenza viruses they carry.


In 2008, in USGS: Genetic Evidence Of The Movement Of Avian Influenza Viruses From Asia To North America, we saw evidence that suggested migratory birds play a larger role in intercontinental spread of avian influenza viruses than previously thought.


A couple of years later, in Where The Wild Duck Goes, we looked at a USGS program that used Satellite Tracking To Reveal How Wild Birds May Spread Avian Flu.  While it was H5N8 that finally made the jump to north America, at the time, the HPAI fear was from the H5N1 virus . From the report:


“Because northern pintails in Alaska exchange influenza viruses with Asian birds, movement of the H5N1 virus into eastern Russia would increase the risk for its transmission to North America via wild birds -- such as the northern pintail -- that migrate between continents,” said Hupp.


Although Atlantic crossing migratory birds are considered potential vectors of avian flu (see The North Atlantic Flyway Revisited), the relatively short distance between Alaska and Siberia – a preferred summer nesting spot for many migratory species – makes the Pacific flyway particularly vulnerable.


Yesterday a new study was published in the Journal Virology which provides even more evidence of this intercontinental avian influenza exchange program.


Dispersal of H9N2 influenza A viruses between East Asia and North America by wild birds

Andrew M. Rameya, , , Andrew B. Reevesa, Sarah A. Sonsthagena, Joshua L. TeSlaab, Sean Nasholdb, Tyrone Donnellya, Bruce Caslerc, Jeffrey S. Hallb

Highlights

• 2924 wild bird samples from western Alaska were screened for influenza A viruses.

• Among 90 viral isolates recovered were two viruses of the H9N2 subtype.

• H9N2 subtype isolates were nearly identical with viruses from China and South Korea.

• Results provide evidence for intercontinental viral dispersal by migratory birds.

Abstract

Samples were collected from wild birds in western Alaska to assess dispersal of influenza A viruses between East Asia and North America. Two isolates shared nearly identical nucleotide identity at eight genomic segments with H9N2 viruses isolated from China and South Korea providing evidence for intercontinental dispersal by migratory birds.


Additional background information is provided by the following USGS press release.


New Technology Helps Identify Dispersal of Avian Flu Virus between Asia and Alaska


Released: 3/31/2015 1:00:00 PM

ANCHORAGE, Alaska — In a new study published today, scientists from the U.S. Geological Survey and U.S. Fish and Wildlife Service harnessed a new type of DNA technology to investigate avian influenza viruses in Alaska.  Using a “next generation” sequencing approach, which identifies gene sequences of interest more rapidly and more completely than by traditional techniques, scientists identified low pathogenic avian influenza viruses in Alaska that are nearly identical to viruses found in China and South Korea.

The viruses were found in an area of western Alaska that is known to be a hot spot for both American and Eurasian forms of avian influenza.

“Our past research in western Alaska has shown that 70 percent of avian influenza viruses isolated in this area were found to contain genetic material from Eurasia, providing evidence for high levels of intercontinental viral exchange,” said Andy Ramey, a scientist with the USGS Alaska Science Center and lead author of the study.  “This is because Asian and North American migratory flyways overlap in western Alaska.”

The new study, led by the USGS, found low pathogenic H9N2 viruses in an Emperor Goose and a Northern Pintail.  Both of the H9N2 viruses were nearly identical genetically to viruses found in wild bird samples from Lake Dongting, China and Cheon-su Bay, South Korea.

“These H9N2 viruses are low pathogenic and not known to infect humans, but similar viruses have been implicated in disease outbreaks in domestic poultry in Asia,” said Ramey.

There is no commercial poultry production in western Alaska and highly similar H9N2 virus strains have not been reported in poultry in East Asia or North America, so it is unlikely that agricultural imports influenced this result.

The finding provides evidence for intercontinental movement of intact avian influenza viruses by migratory birds. The USGS recently released a publication about the detection of a novel highly pathogenic H5N8 virus in the U.S. that is highly similar to the Eurasian H5N8 viruses. This suggests that the novel re-assortment may be adapted to certain waterfowl species, enabling it to survive long migrations. That virus, and associated strains, have now spread from early detections in wild and domestic birds in Pacific states to poultry outbreaks in Minnesota, Missouri and Arkansas.

“The frequency of inter-hemispheric dispersal events of avian influenza viruses by migratory birds may be higher than previously recognized,” said Ramey.

While some of the samples for the project came from bird fecal samples collected from beaches at Izembek National Wildlife Refuge, most of the samples came from sport hunters.

“For the past several years, we’ve worked closely with sport hunters in the fall to obtain swab samples from birds and that has really informed our understanding of wildlife disease in this area,” said Bruce Casler, formerly a biologist with the USFWS Izembek National Wildlife Refuge and a co-author of the study. None of the viruses found in harvested birds from Izembek Refuge are known to infect humans, but hunters should always follow safe meat handling and cooking guidelines when processing wild game.

The paper, “Dispersal of H9N2 influenza A viruses between East Asia and North America by wild birds” was published today in the journal Virology. A summary of all samples collected at the Izembek Refuge will be described in a subsequent publication.

Additional information about avian influenza can be found at the following web sites:


For years the rallying cry that `Sick birds don’t fly’ has been used to argue that migratory birds aren’t to blame for the spread of the virus, even though it has been shown that some species of birds (particularly ducks) can carry – and presumably spread – the virus asymptomatically.


A recent statement by the UN CMS/FAO Co-Convened Scientific Task Force on Avian Influenza and Wild Birds maintains that typically the spread of HPAI virus is via contaminated poultry, poultry products and inanimate objects although wild birds may also play a role.


We explored the often bitter debate between the poultry industry and conservationists over the role of migratory birds in spreading avian flu in Bird Flu Spread: The Flyway Or The Highway?, and while poultry industry practices often factor heavily, it is hard to refute the notion that wild birds are at least partially responsible.


For more on the role of migratory birds, you may wish to revisit:


Erasmus Study On Role Of Migratory Birds In Spread Of Avian Flu

PNAS: H5N1 Propagation Via Migratory Birds

EID Journal: A Proposed Strategy For Wild Bird Avian Influenza Surveillance

PLoS One: North Atlantic Flyways Provide Opportunities For Spread Of Avian Influenza Viruses

Friday, July 18, 2014

USGS: Updated U.S. Seismic Risk Hazard Maps

image


# 8846


Yesterday the USGS released a 243 page PDF report outlining the revised seismic hazard risks for the United States – their first major update since 2008 – and among its findings it reports a higher risk of strong quakes in the Eastern United States than previously appreciated. 


Be warned, with hundreds of maps and graphics, this is a very large (113mb) download.


image


Documentation for the 2014 Update of the United States National Seismic Hazard Maps

By Mark D. Petersen, Morgan P. Moschetti, Peter M. Powers, Charles S. Mueller, Kathleen M. Haller, Arthur D. Frankel, Yuehua Zeng, Sanaz Rezaeian, Stephen C. Harmsen, Oliver S. Boyd, Ned Field, Rui Chen, Kenneth S. Rukstales, Nico Luco, Russell L. Wheeler, Robert A. Williams, and Anna H. Olsen
Abstract

The national seismic hazard maps for the conterminous United States have been updated to account for new methods, models, and data that have been obtained since the 2008 maps were released (Petersen and others, 2008). The input models are improved from those implemented in 2008 by using new ground motion models that have incorporated about twice as many earthquake strong ground shaking data and by incorporating many additional scientific studies that indicate broader ranges of earthquake source and ground motion models. These time-independent maps are shown for 2-percent and 10-percent probability of exceedance in 50 years for peak horizontal ground acceleration as well as 5-hertz and 1-hertz spectral accelerations with 5-percent damping on a uniform firm rock site condition (760 meters per second shear wave velocity in the upper 30 m, VS30). In this report, the 2014 updated maps are compared with the 2008 version of the maps and indicate changes of plus or minus 20 percent over wide areas, with larger changes locally, caused by the modifications to the seismic source and ground motion inputs.


Although earthquakes in the Eastern half of the United States have been recorded in the past (including the Charleston, SC earthquake of 1886), the August 2011 5.8 earthquake that rocked Virginia and the Nation’s capital (see USGS Statement On The Virginia Earthquake) provided fresh evidence not only of their potential to occur,  but also how widely felt they may be (see USGS: Eastern Earthquakes - Rare But Powerful).


Another strong quake a few months later in the Heartland (see 5.6 Mag Quake Rattles Oklahoma), has been followed by hundreds of additional quakes in a region not expected to produce that much seismic activity. 


Additional earthquake research has turned up new fault lines in California, and perhaps most worrisome of all, found the potential for a much larger quake from the Cascadia Fault in the Pacific Northwest than previously estimated (see Just A Matter Of Time for more on this threat)


While all 50 states have at least some seismic potential (yes, even Florida), 42 states are viewed as having a reasonable chance of seeing a damaging quake in the next 50 years, and 16 states in particular are considered at highest risk.  The USGS press release states:


The hazard is especially high along the west coast, intermountain west, and in several active regions of the central and eastern U.S., such as near New Madrid, MO, and near Charleston, SC. The 16 states at highest risk are Alaska, Arkansas, California, Hawaii, Idaho, Illinois, Kentucky, Missouri, Montana, Nevada, Oregon, South Carolina, Tennessee, Utah, Washington, and Wyoming.


While they acknowledge the risks of man-made earthquakes – due primarily to fracking and injection wells – research into these hazards is just getting started.  The USGS states:


Induced Earthquakes … Research Underway

Some states have experienced increased seismicity in the past few years that may be associated with human activities such as the disposal of wastewater in deep wells.

One specific focus for the future is including an additional layer to these earthquake hazard maps to account for recent potentially triggered earthquakes that occur near some wastewater disposal wells. Injection-induced earthquakes are challenging to incorporate into hazard models because they may not behave like natural earthquakes and their rates change based on man-made activities.


While it may not be predictive of future events, so far 2014 has provided a major uptick in seismic activity in the United States, and around the globe.  Southern California, Alaska, and California have all reported increased activity (see LA Times Quakes are increasing, but scientists aren't sure what it means).


Last December, in Dr. Lucy Jones: `Imagine America Without Los Angeles’, we looked at a presentation given by Dr. Jones at the  annual meeting of the American Geophysical Union (held this year in San Francisco),  that emphasized that should the `big one’ hit Southern California, we could literally `lose’ Los Angeles.


She warned that the damage could be far greater, and last much longer, than most people believe.  While 99 out of 100 modern buildings might remain standing, the (often buried) infrastructure needed to provide water, electricity, internet connectivity, and natural gas – the lifeblood -  to the region could be devastated (see CBS News report).


If this sounds like hyperbole, in 2010 (see Revised Risk Of `The Big One’ Along San Andreas Fault) we looked at a study that suggested that Southern California may be more overdue for another major quake than previously thought, and in the following year (see Estimating The Economic Impact Of A San Andreas Quake) we looked at a report from the U.S. Bureau of Labor Statistics that endeavored to gauge the crippling impact that a highly feasible (and long overdue) 7.8 magnitude Southern California earthquake would have on jobs and local businesses.

image

Download PDF file

A quake of this magnitude, they estimate, could affect  430,000 businesses and 4.5 million workers and deliver a devastating – and prolonged – blow to the local (and national) economy.


While attempts at predicting earthquakes have met with little success, we do know that over time, seismically active regions will be hit again and again, and that the only defense is to be prepared for when that happens.


Seismic threats extend beyond earthquakes, as they encompass volcanic eruptions (see Washington State: Volcano Awareness Month) - and Tsunamis – both of which have the ability to affect both people and property thousands of miles away from the originating event  (see The USGS West Coast Tsunami Scenario Report & East Coast Tsunami Threats).


Which is why everyone should have a disaster plan, not just those who live in an earthquake zone.


As a bare minimum, everyone should have a well thought out disaster and family communications plan, along with a good first aid kit, a `bug-out bag’, and sufficient emergency supplies to last at least 72 hours.


In When 72 Hours Isn’t Enough, I highlighted  a colorful, easy-to-follow, 100 page `survival guide’ released by Los Angeles County, that covers everything from earthquake and tsunami preparedness, to getting ready for a pandemic.

image

The guide may be downloaded here (6.5 Mbyte PDF).

While designed specifically for the nearly 10 million residents of Los Angeles County, this guide would be a valuable asset for anyone interested in preparing for a variety of hazards. And in Los Angeles, the advice is to have emergency supplies (food, water, etc) to last up to 10 days. In my humble opinion, 2-weeks in an earthquake zone isn’t overkill.


Working to improve earthquake awareness, preparation, and safety is Shakeout.org, which promotes yearly earthquake drills and education around the country (see NPM13: A Whole Lotta Shakeouts Going On).  If you live in one of these seismically active areas, I would encourage you to take part in these yearly drills.

image

To become better prepared as an individual, family, business owner, or community to deal with all types of disasters, I would invite you to visit the following preparedness sites.


FEMA http://www.fema.gov/index.shtm

READY.GOV http://www.ready.gov/

AMERICAN RED CROSS http://www.redcross.org/


And lastly, in NPM13: The Greatest Prep Of All,  I wrote about what I consider to be the most important preparedness step you can take – having, and being,  a disaster buddy.  Cultivating a network of family and friends to whom you can turn for help in a disaster, to who can turn to you for aid,  if they need it.


Because no matter where you live, its just a matter of time before the next disaster strikes.

Tuesday, May 06, 2014

USGS/OGS Joint Statement On Increased Earthquake Threat To Oklahoma

image

USGS-OGS Oklahoma Earthquake Activity


# 8577


In 2009, after decades of little or no serious seismic activity, the number of earthquakes in Oklahoma began tor rise.  In 2011, a 5.6 Mag Quake Rattled Oklahoma, which was the strongest quake in that state’s history. Since then, the number of quakes has continued to increase, which has been the subject of several blogs here at AFD.


USGS: Oklahoma Earthquake Swarm Update

Oklahoma Insurance Commissioner Warns On Earthquake Risks

USGS: Oklahoma Earthquake Swarm Continues


While 2013 was a record year for Oklahoma quakes over M3.0, the first 5 months of 2014 have produced quakes at more than twice last year’s rate, leading the USGS and the Oklahoma Geological Survey  (OGS) to issue a joint statement on the ongoing earthquake risk in that state.


First a link, and a few excerpt from that statement, after which I’ll return with more.


Record Number of Oklahoma Tremors Raises Possibility of Damaging Earthquakes

oklahoma-geological-survey Updated USGS-Oklahoma Geological Survey Joint Statement on Oklahoma Earthquakes
Originally Released: 10/22/2013 1:07:59 PM; Updated May 2, 2014

The rate of earthquakes in Oklahoma has increased remarkably since October 2013 – by about 50 percent – significantly increasing the chance for a damaging magnitude 5.5 or greater quake in central Oklahoma.

View map of Oklahoma seismicity.
View animation of Oklahoma Seismicity.

A new U.S. Geological Survey and Oklahoma Geological Survey analysis found that 145 earthquakes of magnitude 3.0 or greater occurred in Oklahoma from January 2014 (through May 2; see accompanying graphic). The previous annual record, set in 2013, was 109 earthquakes, while the long-term average earthquake rate, from 1978 to 2008, was just two magnitude 3.0 or larger earthquakes per year. Important to people living in central and north-central Oklahoma is that the likelihood of future, damaging earthquakes has increased as a result of the increased number of small and moderate shocks.

Oklahoma’s heightened earthquake activity since 2009 includes 20 magnitude 4.0 to 4.8 quakes, plus the largest earthquake in Oklahoma’s history – a magnitude 5.6 earthquake that occurred near Prague on Nov. 5, 2011. The 2011 Prague earthquake damaged a number of homes and the historic Benedictine Hall at St. Gregory's University in Shawnee. Prior to the 2011 Prague earthquake, the largest earthquake of Oklahoma’s history was a magnitude 5.5 earthquake that occurred in 1952 near El Reno and damaged state buildings in Oklahoma City.

“While it’s been known for decades that Oklahoma is ‘earthquake country’, we hope that this new advisory of increased hazard will become a crucial consideration in earthquake preparedness for residents, schools and businesses in the area,” said Dr. Bill Leith, Senior Science Advisor for Earthquakes and Geologic Hazards at USGS. “Building owners and government officials should have a special concern for older, unreinforced brick structures, which are vulnerable to serious damage during sufficient shaking.”

(Continue . . .)


While no specific predictions as to time, location, or intensity are offered, these agencies believe there is a heightened risk for larger, potentially damaging earthquakes in Oklahoma – at least in the near term.


The bottom line is that Oklahomans (and anyone else who lives an a seismically active region) need to seriously include earthquake preparedness as part of their overall emergency plans.


The State of Oklahoma maintains an earthquake safety webpage at EARTHQUAKE SAFETY,  while additional Oklahoma specific earthquake monitoring and research information can be found at the Oklahoma Geological Survey.


Although the west coast is most noted for its seismic hazards, much of America’s heartland and parts of the Eastern Seaboard are also susceptible to moderate to strong quakes.   A topic I covered more than a year ago in USGS: Eastern Earthquakes - Rare But Powerful.


image


At a bare minimum, every household should have a disaster plan, a good first aid kit (and the knowledge to use it), an emergency battery operated NWS weather radio, and emergency supplies to last a minimum of 72 hours during a disaster.To become better prepared as an individual, family, business owner, or community, I would invite you to visit the following preparedness sites.

FEMA http://www.fema.gov/index.shtm

READY.GOV http://www.ready.gov/

AMERICAN RED CROSS http://www.redcross.org/


For more on increasing your level of preparedness, a partial list of some of my preparedness blogs include:

When 72 Hours Isn’t Enough

In An Emergency, Who Has Your Back?

An Appropriate Level Of Preparedness

Wednesday, April 02, 2014

USGS Warns On Fake Earthquake Alert

image

Earthquake Hoax warning from the USGS


#8424


With a couple of medium-sized temblors in Los Angeles in recent weeks, an ongoing swarm of quakes in Oklahoma, and another medium-sized temblor last week in Yellowstone, I guess it was inevitable that the prognosticators of perpetual doom on the internet would begin to predict that California was about to fall into the Pacific, or that the Yellowstone Supervolcano would destroy the North American continent.


These are always popular memes on the internet, and are aided and abetted by disastertainment cable-TV `documentaries’  like Doomsday Preppers, and Mega-Disasters.


Most people are savvy enough to discount these predictions as having no scientific merit, but when they come on what purports to be a USGS letterhead, they are more likely to be taken seriously. 


And that, unfortunately, is exactly what has happened over the past few days as a fake USGS warning has been emailed (and no doubt breathlessly forwarded) predicting a impending major earthquake in California.

image

Fake Earthquake Warning 


As far as predicting earthquakes, the USGS has this to say:


Can you predict earthquakes?

No. Neither the USGS nor any other scientists have ever predicted a major earthquake. They do not know how, and they do not expect to know how any time in the foreseeable future. However based on scientific data, probabilities can be calculated for potential future earthquakes. For example, scientists estimate that over the next 30 years the probability of a major EQ occurring in the San Francisco Bay area is 67% and 60% in Southern California.The USGS focuses their efforts on the long-term mitigation of earthquake hazards by helping to improve the safety of structures, rather than by trying to accomplish short-term predictions.

Learn more: Earthquake Prediction


While short term predictions such as the one in the hoax letter are best ignored, the reality is that earthquakes can and do happen, and those who live in seismically active regions need to be prepared to deal with them.  


This from California’s Earthquake Preparedness Website:

image

April is Earthquake Preparedness Month, it has been recognized since the April 1906 San Francisco earthquake and continues to be supported by the state assembly urging all Californians and government agencies to engage in education, evaluation of seismic hazards, mitigation, safety activities, and the exchange of information related to earthquake preparedness with other states and nations.

Surprisingly, many Californians don't consider themselves at risk unless they live on or near the line of a well-known fault, such as the San Andreas or Hayward Fault. This misconception leaves millions of Californians unprepared for an earthquake.

Quick Facts:

  • Major earthquakes registering magnitudes between 6.3 and 8.3 have occurred in California every 5.4 years, on average, for the past 200 years.
  • The United States Geological Survey estimates that there is a 90 percent chance that a major earthquake will strike an urban area in California within the next 30 years.
  • The majority of Californians live within 20 miles of a major earthquake fault.
  • Being prepared could save your life!

While California is a world leader in emergency response and recovery capabilities, our responders can't do it alone. It is the responsibility of every individual to take action, get informed, and get actively involved in emergency preparedness.

(Continue . . .)

For more information I would encourage you to visit:

FEMA http://www.fema.gov/index.shtm

READY.GOV http://www.ready.gov/

AMERICAN RED CROSS http://www.redcross.org/

A few of my (many) blogs on disaster preparedness include:

  • In An Emergency, Who Has Your Back?
  • When 72 Hours Isn’t Enough
  • When Evacuation Is The Better Part Of Valor
  • Saturday, March 29, 2014

    Los Angeles M5.1: Californians Shaken & Hopefully Stirred

    image


    # 8413


    Overnight, and as 2014’s National Tsunami Preparedness Week winds down,  the city of Los Angeles was rocked by a moderately strong earthquake (Mag 5.1), causing some minor damage and rattling nerves across a wide swath of Southern California.   Three hours after the quake, the Los Angeles Times was reporting 5.1 earthquake causes damage; some flee from homes.


    While a far cry from `the big one’, California residents are advised by USGS seismologist Lucy Jones that there is about a 5% chance that this quake could be a foreshock, and that another – larger quake – could occur in the hours or days ahead (Larger L.A. earthquake possible after 5.1 temblor, USGS says).


    First the Tectonic Summary from the USGS, then I’ll be back with a bit more about earthquake preparedness.


    image

    Tectonic Summary

    A M5.1 earthquake occurred at 9:09PM on March 28, 2014, located 1 mile easy of La Habra, CA, or 4 miles north of Fullerton, CA. The event was felt widely throughout Orange, Los Angeles, Ventura, Riverside, and San Bernardino counties.  It was preceded by two foreshocks, the larger of M3.6 at 8:03pm.  The demonstration earthquake early warning system provided 4 second warning in Pasadena. 

    There have been 23 aftershocks as of 10:00PM on March 28, the largest of which was a M3.6 at 9:30PM, and was felt locally near the epicenter. The aftershock sequence may continue for several days to weeks, but will likely decay in frequency and magnitude as time goes by.

    The maximum observed instrumental intensity was VII, recorded in the LA Habra and Brea areas, although the ShakeMap shows a wide area of maximum intensity of VI. The maximum reported intensity for the Did You Feel It? map was reported at VI in the epicentral area.

    This sequence could be associated with the Puente Hills thrust (PHT).  The PHT is a blind thrust fault that extends from this region to the north and west towards the City of Los Angeles.  It caused the M5.9 1987 Oct. 1 Whittier Narrows earthquake. 

    Previously, the M5.4 2008 Chino Hills earthquake occurred in this region.  It caused somewhat stronger shaking in Orange County and across the Los Angeles Basin. 

    The moment tensor shows oblique faulting, with a north dipping plane that approximately aligns with the Puente Hills thrust.


    Last December, in Dr. Lucy Jones: `Imagine America Without Los Angeles’, we looked at a presentation given by Dr. Jones at the  annual meeting of the American Geophysical Union (held this year in San Francisco),  that emphasized that should the `big one’ hit Southern California, we could literally `lose’ Los Angeles.


    She warned that the damage could be far greater, and last much longer, than most people believe.  While 99 out of 100 modern buildings might remain standing, the (often buried) infrastructure needed to provide water, electricity, internet connectivity, and natural gas – the lifeblood -  to the region could be devastated (see CBS News report).


    If this sounds like hyperbole, in 2010 (see Revised Risk Of `The Big One’ Along San Andreas Fault) we looked at a study that suggested that Southern California may be more overdue for another major quake than previously thought, and in the following year (see Estimating The Economic Impact Of A San Andreas Quake) we looked at a report from the U.S. Bureau of Labor Statistics that endeavored to gauge the crippling impact that a highly feasible (and long overdue) 7.8 magnitude Southern California earthquake would have on jobs and local businesses.

    image

    Download PDF file

    A quake of this magnitude, they estimate, could affect  430,000 businesses and 4.5 million workers and deliver a devastating – and prolonged – blow to the local (and national) economy.


    For a comprehensive guide on how you can prepare for `the big one’ (even if you live someplace other than Los Angeles), I would recommend you download, read, and implement the advice provided by the The L. A. County Emergency Survival Guide.  


    As you’ll notice, Los Angeles recommends having more than just a 72 hour emergency kit.

    image

    It isn’t enough to have a kit, and a plan during an earthquake. You need to know what to do to protect life and limb while the shaking is going on.  And for that, we have the ever-growing Great Shakeout Drill (see  NPM13: A Whole Lotta Shakeouts Going On).

    image


    While there is admittedly a 95% chance that there won’t be a large aftershock to this quake, it only takes being caught unprepared for a single major disaster to ruin your entire day.


    For more information on emergency preparedness, I would invite you  to visit:

    FEMA http://www.fema.gov/index.shtm

    READY.GOV http://www.ready.gov/

    AMERICAN RED CROSS http://www.redcross.org/

    And some of my preparedness blogs, including:

    When 72 Hours Isn’t Enough

    The Gift Of Preparedness: 2013

    In An Emergency, Who Has Your Back?

    Thursday, March 20, 2014

    PLoS One: North Atlantic Flyways Provide Opportunities For Spread Of Avian Influenza Viruses

    image

    Global Flyways – Credit FAO 


    # 8389


    It is pretty clear from the way the HPAI H5N1 virus spread out of South East Asia to Europe and the Middle East in the middle of the last decade, that migratory birds can play a major role in its dissemination.  These birds can often carry avian influenza viruses without ill effect, and when they encounter other birds, can `share’ their viral cargo along their migratory flyway.


    Where flyways overlap, there is a greater chance of spreading a virus from one region to another. And as you can see by the map above, they overlap a lot.


    Japan and Korea – both overwintering sites for migratory birds that summer in Asia and Siberia – have seen the seasonal arrival of H5N1 in years past (see What Goes Around, Comes Around), and this winter Korea has found itself battling a viral  foe: H5N8.  Again, thought to have been introduced by migratory birds from China (see Korea: Migratory Birds Likely Source Of H5N8 Outbreak).


    While the HPAI viruses originating in Asia have yet to make it to North America via these migratory birds, the concern remains that it could happen.   Accordingly, the Pacific Flyways have been viewed with the most interest, as this would be the most direct route for H5N1, H7N9, or H5N8 to jump to the Americas.   


    But European birds can carry HPAI viruses as well, and new reassortant viruses can emerge anywhere, not just in Asia (see EID Journal: Predicting Hotspots for Influenza Virus Reassortment). 

    image

    Reassortment of two Avian Viruses Producing a Hybrid (Reassortant) Virus 


    So while less obvious a threat, the North Atlantic Flyways are considered a potential air-bridge for the introduction of new (or components for a reassorted) virus to North America.  Yesterday, the open access journal PLoS One published a study funded by the USGS and NIAID that confirms this potential.  


    First the press release from the USGS, then a link to the study and some excerpts. I’ll have a bit more after.


    North Atlantic May Be a New Route for Spread of Avian Flu to North America


    Released: 3/19/2014 5:10:00 PM

    image

    The North Atlantic region is a newly discovered important pathway for avian influenza to move between Europe and North America, according to a U.S. Geological Survey report published today.

    USGS scientists and Icelandic partners found avian flu viruses from North America and Europe in migratory birds in Iceland, demonstrating that the North Atlantic is as significant as the North Pacific in being a melting pot for birds and avian flu. A great number of wild birds from Europe and North America congregate and mix in Iceland's wetlands during migration, where infected birds could transmit avian flu viruses to healthy birds from either location.

    By crossing the Atlantic Ocean this way, avian flu viruses from Europe could eventually be transported to the United States. This commingling could also lead to the evolution of new influenza viruses. These findings are critical for proper surveillance and monitoring of flu viruses, including the H5N1 avian influenza that can infect humans.

    "None of the avian flu viruses found in our study are considered harmful to humans," said Robert Dusek, USGS scientist and lead author of the study. "However, the results suggest that Iceland is an important location for the study of avian flu and is worthy of special attention and monitoring."

    The study also highlighted the new finding that gulls play an important role in moving avian flu viruses across the North Atlantic.

    During the spring and autumn of 2010 and autumn of 2011, the USGS researchers and Icelandic partners collected avian influenza viruses from gulls and waterfowl in southwest and west Iceland (see map). By studying the virus’ genomes — an organism’s hereditary information — the researchers found that some viruses came from Eurasia and some originated in North America. They also found viruses with mixed American-Eurasian lineages.

    "For the first time, avian influenza viruses from both Eurasia and North America were documented at the same location and time," said Jeffrey Hall, USGS co-author and principal investigator on this study. "Viruses are continually evolving, and this mixing of viral strains sets the stage for new types of avian flu to develop."

    (Continue . . . )


    Excerpts from PLoS One:


    North Atlantic Migratory Bird Flyways Provide Routes for Intercontinental Movement of Avian Influenza Viruses

    Robert J. Dusek mail, Gunnar T. Hallgrimsson, Hon S. Ip, Jón E. Jónsson, Srinand Sreevatsan, Sean W. Nashold, Joshua L. TeSlaa, Shinichiro Enomoto, Rebecca A. Halpin, Xudong Lin, Nadia Fedorova, Timothy B. Stockwell, Vivien G. Dugan,  [ ... ], Jeffrey S. Hall

    Abstract

    Avian influenza virus (AIV) in wild birds has been of increasing interest over the last decade due to the emergence of AIVs that cause significant disease and mortality in both poultry and humans. While research clearly demonstrates that AIVs can move across the Pacific or Atlantic Ocean, there has been no data to support the mechanism of how this occurs. In spring and autumn of 2010 and autumn of 2011 we obtained cloacal swab samples from 1078 waterfowl, gulls, and shorebirds of various species in southwest and west Iceland and tested them for AIV. From these, we isolated and fully sequenced the genomes of 29 AIVs from wild caught gulls (Charadriiformes) and waterfowl (Anseriformes) in Iceland. We detected viruses that were entirely (8 of 8 genomic segments) of American lineage, viruses that were entirely of Eurasian lineage, and viruses with mixed American-Eurasian lineage. Prior to this work only 2 AIVs had been reported from wild birds in Iceland and only the sequence from one segment was available in GenBank. This is the first report of finding AIVs of entirely American lineage and Eurasian lineage, as well as reassortant viruses, together in the same geographic location. Our study demonstrates the importance of the North Atlantic as a corridor for the movement of AIVs between Europe and North America.

    Discussion

    In this study we isolated 11 unique AIVs in gulls and waterfowl from Iceland that contained unexpectedly high viral genetic diversity. Most significantly, we obtained viruses that were completely (all 8 segments) of Eurasian lineage or American lineage as well as reassortant American and Eurasian lineage viruses. Previous to this study there have been no reports of complete American or Eurasian lineage viruses in the same geographic location [12], [25].

    When Eurasian AIV segments have been detected in the Americas, or American AIV segments in Eurasia, it has generally been only 1 or 2 segments per virus [12], [18], [19], [25]. However, 2 recent studies in North America have found viruses with near complete (7 of 8 segments) Eurasian lineage genomes [16], [19]. Both of these studies were conducted in regions where predominately Eurasian flyways overlap into North America (the East Asian Flyway and the East Atlantic Flyway). Iceland is within the East Atlantic Flyway (Figure 2); this flyway extends into North America (Greenland and eastern Canada) and tens of thousands of migratory birds move from North America into Europe along this route on their way to and from breeding and non-breeding grounds [31], [32].

    Our data demonstrate that the North Atlantic serves as a route for intercontinental movement of AIV and it will be important to track the further dissemination of these viruses, in whole, or in part, into the Icelandic avian community and, more significantly, into the avian communities of Europe or North America.

    (Continue . . . )


    While we’ve seen a lot of evidence to support the idea that migratory birds play an important role in the spread of avian viruses, not everyone agrees. 


    Last month in Korea: H5N8 Spreads, Debate Over Source Intensifies, the Scientific Task Force on Avian Influenza and Wild Birds argued against migratory birds being the source of that virus in Korea.  Similarly, in years past we’ve seen other experts decry the blaming of migratory birds in the spread of H5N1 (see India: The Role Of Migratory Birds In Spreading Bird Flu & Another Migratory Bird Study).


    Despite these somewhat partisan assertions, there have been plenty of other studies that strongly associate migratory birds with the spread of avian flu viruses. A few include:


    Korea: Migratory Birds Behind Spread Of H5N1

    EID Journal: H5N1 Branching Out

    Japan: Hooded Crane Positive For H5N1

    Not One Of The Usual Suspects

    FAO: On The Trail Of Avian Influenza


    Whether this North Atlantic flyway will provide a route for new HPAIs to show up in the Americas is unknown, but it does illustrate the folly in becoming too focused on one area of the world, when others are perfectly capable of serving up a viral surprise.

    Wednesday, March 05, 2014

    USGS: Oklahoma Earthquake Swarm Update

    image

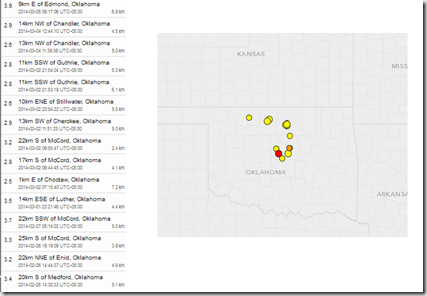
    M2.5+  Swarm last 7 Days -  Credit USGS  Earthquake Map


    # 8351


    Last November, in Oklahoma Insurance Commissioner Warns On Earthquake Risks,  I wrote about the recent uptick in moderate earthquake activity in and around Oklahoma City, OK which began in earnest back in 2009. This `swarm’ includes the largest earthquake ever reported in Oklahoma, a 5.6 Mag Quake near Prague on Nov. 5, 2011.


    While most of Oklahoma’s temblors since then have come in under 4.0, on average they’ve seen at least a couple of 2.5+ quakes every day for the past month.  Not strong enough to cause significant damage, but strong enough to be felt, and to raise concerns.


    Today, the USGS is reporting a M3.9 - 9km E of Edmond, Oklahoma, the strongest temblor in that region since February 8th’s M4.1 quake. 


    Earlier this year, the USGS produced the following update, which links the increase in earthquake activity in the Midwest and East to induced seismicity – or man-made causes.

    Man-Made Earthquakes Update

    Categories: Featured, Natural Hazards
    Posted on January 17, 2014 at 1:00 pm
    Last update 2:03 pm By: William Ellsworth (ellsworth@usgs.gov), Jessica Robertson (jrobertson@usgs.gov), and Christopher Hook (703-648-4460)

    Seismicity of the coterminous United States and surrounding regions, 2009–2012. Black dots denote earthquakes with a magnitude ≥ 3.0 are shown; larger dots denote events with a magnitude ≥ 4.0. Background colors indicate earthquake hazard levels from the U.S. National Seismic Hazard Map (NSHM). Learn more about the NSHM at http://earthquake.usgs.gov/hazards/?source=sitenav.

    Seismicity of the coterminous United States and surrounding regions, 2009–2012. Black dots denote earthquakes with a magnitude ≥ 3.0 are shown; larger dots denote events with a magnitude ≥ 4.0. Background colors indicate earthquake hazard levels from the U.S. National Seismic Hazard Map (NSHM). Learn more about the NSHM at http://earthquake.usgs.gov/hazards/?source=sitenav.


    The number of earthquakes has increased dramatically over the past few years within the central and eastern United States. Nearly 450 earthquakes magnitude 3.0 and larger occurred in the four years from 2010-2013, over 100 per year on average, compared with an average rate of 20 earthquakes per year observed from 1970-2000.

    This increase in earthquakes prompts two important questions: Are they natural, or man-made? And what should be done in the future as we address the causes and consequences of these events to reduce associated risks? USGS scientists have been analyzing the changes in the rate of earthquakes as well as the likely causes, and they have some answers.

    USGS scientists have found that at some locations the increase in seismicity coincides with the injection of wastewater in deep disposal wells. Much of this wastewater is a byproduct of oil and gas production and is routinely disposed of by injection into wells specifically designed for this purpose.

    Review Article on Injection-Induced Earthquakes

    U.S. Geological Survey geophysicist William Ellsworth reviewed the issue of injection-induced earthquakes in a July 2013 study published in the journal Science. The article focused on the injection of fluids into deep wells as a common practice for disposal of wastewater, and discusses recent events and key scientific challenges for assessing this hazard and moving forward to reduce associated risks.

    What is Induced Seismicity?

    Although it may seem like science fiction, man-made earthquakes have been a reality for decades. It has long been understood that earthquakes can be induced by impoundment of water in reservoirs, surface and underground mining, withdrawal of fluids and gas from the subsurface, and injection of fluids into underground formations.

    (Continue . . . )

    While the scientific debate over the exact cause of, and best remedy for, this increased seismic activity continues, last October the USGS warned (bolding mine):


    Important to people living in the Oklahoma City region is that earthquake hazard has increased as a result of the swarm. USGS calculates that ground motion probabilities, which relate to potential damage and are the basis for the seismic provisions of building codes, have increased in Oklahoma City as a result of this swarm.  While it’s been known for decades that Oklahoma is "earthquake country," the increased hazard has important implications for residents and businesses in the area.


    Which means that Oklahomans (and anyone else who lives an a seismically active region) need to seriously include earthquake preparedness as part of their overall emergency plans. The State of Oklahoma maintains an earthquake safety webpage at EARTHQUAKE SAFETY,  while additional Oklahoma specific earthquake monitoring and research information can be found at the Oklahoma Geological Survey.


    Although the west coast is most noted for its seismic hazards, much of America’s heartland and parts of the Eastern Seaboard are also susceptible to moderate to strong quakes.   A topic I covered more than a year ago in USGS: Eastern Earthquakes - Rare But Powerful


    image


    At a bare minimum, every household should have a disaster plan, a good first aid kit (and the knowledge to use it), an emergency battery operated NWS weather radio, and emergency supplies to last a minimum of 72 hours during a disaster.To become better prepared as an individual, family, business owner, or community, I would invite you to visit the following preparedness sites.


    FEMA http://www.fema.gov/index.shtm

    READY.GOV http://www.ready.gov/

    AMERICAN RED CROSS http://www.redcross.org/

    For more on increasing your level of preparedness, a partial list of some of my preparedness blogs include:

    When 72 Hours Isn’t Enough

    In An Emergency, Who Has Your Back?

    An Appropriate Level Of Preparedness