Showing posts with label BMC. Show all posts

Monday, October 27, 2014

BMC: H10N8 Antibodies In Animal Workers – Guangdong Province, China

Photo: ©FAO/Tariq Tinazay

Credit FAO


# 9255


Avian H10 viruses haven’t garnered a lot of attention until relatively recently, as they rarely produce symptoms in poultry, and human infections have been both rare, and mild.  All of that changed last winter when China reported three fatal H10N8 infections (see Jiangxi Province Reports 3rd H10N8 Case) in quick succession.


LPAI (Low Path Avian Influenza) H10N8 had been previously reported in a duck sampled back in 2012 from Guangdong province, but was otherwise not well described. 


Human infections with a close cousin – H10N7 – had previously been reported in two children in Egypt in 2004 (see Avian Influenza Virus A (H10N7) Circulating among Humans in Egypt) and among abattoir workers in Australia in 2012 (see EID Journal: Human Infection With H10N7 Avian Influenza).  


In both cases illness was described as mild, and of short duration.


A side note, we also looked at a recent outbreak of H10N7 in European seals (see Avian H10N7 Linked To Dead European Seals), with warnings to the public to avoid contact.


Since testing for novel flu viruses among humans is only very rarely done, we don’t have a good handle on how often these `oddball’ avian flu viruses actually jump to humans. 


While probably fairly rare – and largely restricted to those who have a lot of contact with wild or domesticated birds – it is is likely more common than we might otherwise think. For more on prior research on seroprevalence of other rare avian influenzas see A Little Background On H11 Avian Influenzas.


In any event, the 2012 detection of H10N8 in a Guangdong duck, followed last year by the infection and deaths of three people from this emerging virus, inspired a group of Chinese scientists go to back and test hundreds of archived blood samples taken prior to the first known human case, to look for signs of previous H10N8 infection.


Although the seroprevalence for this virus appears very low, out of 827 sera tested  they found 21 mildly reactive , with three showing titers of  at least 1:40.  One, with an MN antibody titer of 1:80, was strongly suggestive of prior infection.  With this baseline, future seroprevalence studies of animal workers might provide an indirect early warning system, should this virus continue to spread stealthily in the poultry population.


The study appears in BMC Medicine. (Note there appears to be a temporary problem with the link)


Antibodies against H10N8 Avian Influenza Virus among Animal Workers in Guangdong Province before November 30, 2013, the First Recognized Human H10N8 Case


BMC Medicine 2014, 12:205 doi:10.1186/s12916-014-0205-3


Wenbao Qi, Shuo Su , Chencheng Xiao, Pei Zhou, Huanan Li, Changwen Ke , Gregory C Gray, Guihong Zhang , Ming Liao 

Abstract


Background
Considered an epicenter of pandemic influenza virus generation, southern China has recently seen an increasing number of human H7N9 infections. However, it is not the only threat. On 30 November 2013, a human H10N8 infection case was first described in China. The origin and genetic diversity of this novel virus is similar to that of H7N9 virus. As H10N8 avian influenza virus (AIV) was first identified from a duck in Guangdong Province during 2012 and there is also evidence of H10N8 infected dogs in this region, we sought to examine archived sera from animal workers to see if there was evidence of subclinical human infections before the first human H10N8 cases.


Methods

We studied archived serum samples (cross-sectional study, convenience sample) collected between May and September 2013 from 710 animal workers and 107 non-animal exposed volunteers living in five cities of Guangdong Province. Study participants’ sera were tested by horse red blood cells (RBCs) hemagglutination inhibition (HI) and microneutralization (MN) assays according to World Health Organization guidelines. The A/Jiangxi-Donghu/346-1/2013(H10N8) virus was used. Sera which have an HI assay ≥1:20 were further tested with the MN assay. Questionnaire data were examined for risk factor associations with positive serological assays. Risk factor analyses failed to identify specific factors associated with probable H10N8 infections.


Results

Among the 827 sera, only 21 animal workers had an HI titer ≥1:20 (18 had an HI titer of 1:20 and 3 had an HI titer of 1:40). None of these 21 subjects reported experiencing any influenza symptoms during the three months before enrollment. Among the three subjects with HI titers of 1:40, two had MN antibody titers of 1:40, and one had a MN antibody titer of 1:80 (probable H10N8 infections).


Conclusions

Study data suggest that animal workers may have been infected with the H10N8 virus before the first recognized H10N8 human infection cases. It seems prudent to continue surveillance or H10N8 viruses among animal workers.


Monday, July 28, 2014

BMC: Decline Of Antibody Titers With A(H1N1)pdm Over Time

image

Credit NIAID


# 8875


The arrival of a novel H1N1 influenza pandemic virus in 2009 – the first one in more than 40 years – has provided researchers with unique opportunities to observe how a newly introduced flu virus behaves in humans, and quite frankly, in other species as well (see The 2009 H1N1 Virus Expands Its Host Range (Again)).


Serological studies that would have been impractical before on H3N2 or the old seasonal H1N1 virus – due to decades of ongoing exposure to these strains – suddenly became possible with a new flu in town.


One of the unanswered questions surrounding our immune response to influenza infection is how long does our acquired immunity last?  


Admittedly, the answer to that question will vary from one person to the next, and depend on a variety of factors including the strain of flu, the person’s age, general health, and state of their immune system.  And there seems to be a difference between the duration of immunity gained from actual infection vs. through vaccination.


Despite circulating now for more than 5 years, the (now seasonal) H1N1 virus remains antigenically very similar to the pandemic strain that emerged in the spring of 2009.  So much so that an an A/California/7/2009 (H1N1)pdm09-like virus will be used for the sixth year running in the flu vaccine. 


Yet, despite having a half of decade of vaccination and natural exposure to this new H1N1 virus, last year saw a particularly heavy H1N1 flu season in North America. Normally, we’d look to antigenic drift to explain a major resurgence of a seasonal flu virus after several years, but H1N1 has been remarkably (albeit, not totally) stable in that regard.


Drift is the standard evolutionary path of influenza viruses, and comes about due to replication errors that are common with single-strand RNA viruses (see NIAID Video: Antigenic Drift) Drift is primarily responsible for the need to change flu vaccine strains every couple of years (something that is yet to happen with H1N1).


Another possibility is waning immunity, something that is recognized (particularly with vaccines, and among the elderly), but has been difficult to quantify in the past.  Given the immune system’s tabula rasa with regards to the 2009 H1N1 virus, it has become possible to track the decline of antibody titers of a cohort of individuals who were first exposed five years ago.


Rate of decline of antibody titers to pandemic influenza A (H1N1-2009) by hemagglutination inhibition and virus microneutralization assays in a cohort of seroconverting adults in Singapore

Jung Pu Hsu, Xiahong Zhao, Mark I-Cheng, Alex R Cook, Vernon Lee, Wei Yen Lim, Linda Tan, Ian G Barr, Lili Jiang, Chyi Lin Tan, Meng Chee Phoon, Lin Cui, Raymond Lin, Yee Sin Leo and Vincent T Chow

BMC Infectious Diseases 2014, 14:414  doi:10.1186/1471-2334-14-414

Published: 28 July 2014

Abstract (provisional)

Background

The rate of decline of antibody titers to influenza following infection can affect results of serological surveys, and may explain re-infection and recurrent epidemics by the same strain.

Methods

We followed up a cohort who seroconverted on hemagglutination inhibition (HI) antibody titers (>=4-fold increase) to pandemic influenza A(H1N1)pdm09 during a seroincidence study in 2009. Along with the pre-epidemic sample, and the sample from 2009 with the highest HI titer between August and October 2009 (A), two additional blood samples obtained in April 2010 and September 2010 (B and C) were assayed for antibodies to A(H1N1)pdm09 by both HI and virus microneutralization (MN) assays. We analyzed pair-wise mean-fold change in titers and the proportion with HI titers >= 40 and MN >= 160 (which correlated with a HI titer of 40 in our assays) at the 3 time-points following seroconversion.

Results

A total of 67 participants contributed 3 samples each. From the highest HI titer in 2009 to the last sample in 2010, 2 participants showed increase in titers (by HI and MN), while 63 (94%) and 49 (73%) had reduction in HI and MN titers, respectively.

Titers by both assays decreased significantly; while 70.8% and 72.3% of subjects had titers of >= 40 and >= 160 by HI and MN in 2009, these percentages decreased to 13.9% and 36.9% by September 2010. In 6 participants aged 55 years and older, the decrease was significantly greater than in those aged below 55, so that none of the elderly had HI titers >= 40 nor MN titers >= 160 by the final sample.

Due to this decline in titers, only 23 (35%) of the 65 participants who seroconverted on HI in sample A were found to seroconvert between the pre-epidemic sample and sample C, compared to 53 (90%) of the 59 who seroconverted on MN on Sample A.

Conclusions

We observed marked reduction in titers 1 year after seroconversion by HI, and to a lesser extent by MN. Our findings have implications for re-infections, recurrent epidemics, vaccination strategies, and for cohort studies measuring infection rates by seroconversion.

The complete article is available as a provisional PDF. The fully formatted PDF and HTML versions are in production.


The entire study is available, and well worth reading, but I’ve excerpted two paragraphs below that sum up their findings.  

Discussion


The objective of our study was to understand temporal changes in antibody titers following seroconversion during the initial epidemic of A(H1N1)pdm09 infections in  Singapore. Our results revealed a fairly rapid decline in antibody titers following seroconversion, with only a fifth of those who originally had HI titers of  ≥40 and half of those with MN titers of  ≥160 still  having  titers  above  the  respective  cut-off  points  after  a  year.  There  was  also  some indication  that  the  rate  of  decline  was  higher  in  older  individuals,  and  that  the  change  in antibody  titers  measured  by  HI  was  greater  than  by  MN.  Symptomatic  infections  were associated with higher starting antibody titers, and continued to have marginally higher titers in subsequent samples, at least by MN assays.


<SNIP>

Conclusions


Six  months  and  one  year  after  antibodies  peaked  following  presumptive  infection  with A(H1N1)pdm09, only 25% and 14% of participants respectively had antibody  titers against A(H1N1)pdm09 that would be considered protective (HI titer ≥40). The decline in antibody titers may explain susceptibility to re-infections, and recurrent epidemics following the initial epidemic of infections during the pandemic. It also suggests that influenza vaccination may have to be administered more frequently in the tropics where there is year-round circulation of influenza viruses. The rate of decline in elderly individuals may be even more rapid, and if our  findings  are  confirmed,  may  necessitate  alternative  strategies  of  influenza  vaccine development for this vulnerable group.


A pretty good reminder that even if you got the vaccine last year – or worse, endured the flu last winter – you may not be carrying sufficient immunity forward into the new flu season to protect you against re-infection. 


And given that H3N2, and two lineages of Influenza B, are also in circulation – your risks of catching some kind of flu are compounded further.


Which is why, even though the H1N1 component of the flu vaccine remains unchanged this year, it is a good idea to get the flu vaccine every year.  


Despite variable and sometimes disappointing VE (Vaccine Effectiveness) numbers (see CIDRAP: A Comprehensive Flu Vaccine Effectiveness Meta-Analysis) - particularly among the elderly (see BMC Infectious Diseases: Waning Flu Vaccine Protection In the Elderly) - we continue to see evidence of substantial benefit from the flu shot.


For more, you may wish to revisit:


CDC: Flu Shots Reduce Hospitalizations In The Elderly
Research: Low Vaccination Rates Among 2013-2014 ICU Flu Admissions
Two Studies On The 2009 Pandemic Flu Vaccine & Pregnancy

Thursday, June 12, 2014

BMC Research Notes: Unanswered Questions About MERS-CoV

image

Credit CDC MERS Webpage


# 8733


To paraphrase Harry Truman (who was talking about economists), when it comes to figuring out the MERS virus, what we really need is a one-armed epidemiologist . . .  someone who can’t say, `But, on the other hand . .  .’


Practically at every turn, we are faced with some kind of inconsistency with this emerging disease, making it almost impossible to quantify its current, and future, public health risk.


While the vast majority of close contacts of known cases have tested negative, inexplicably the virus seems to thrive in a healthcare environment. We’ve seen numerous nosocomial clusters - and more than 100 healthcare workers infected – yet similar outbreaks in other community venues are rare.


Some family clusters have been reported, but they pale in comparison to hospital clusters, where strict infection control practices are supposedly in place.   


Males outnumber females (particularly as index cases), and children and adolescents are only very rarely reported infected, despite being a large demographic in Middle East 


And we haven’t a clue why either should be true.


Community-acquired cases continue to pop up, but their source remains largely unknown.  Contact with camels, or camel products is suspected, but unproven.  But in truth, there are likely several routes of infection in the community – including contact with mildly symptomatic or asymptomatic cases – making it difficult to pin down any one specific cause.


Two years into this slow-rolling epidemic, and we still know  frustratingly little about its source, how the virus is transmitted, and where this epidemiological enigma will go from here. 


By comparison, the SARS epidemic was over – and its source identified and quashed – eight months after it first emerged in China.


This high degree of uncertainty explains the wariness demonstrated by public health agencies around the world (see Hong Kong Unveils Their MERS-CoV Preparedness Plan) regarding this virus, even though the actual case count and death toll remains pretty low.


Today Lauren M Gardner and C Raina MacIntyre - both from The University of New South Wales ( Sydney, Australia) -take a closer look at this coronavirus conundrum in an open-access research note called:


Unanswered questions about the Middle East respiratory syndrome coronavirus (MERS-CoV)

Lauren M Gardner and C Raina MacIntyre

BMC Research Notes 2014, 7:358  doi:10.1186/1756-0500-7-358

Published: 11 June 2014

Abstract (provisional)

Background

The Middle East respiratory syndrome coronavirus (MERS-CoV) represents a current threat to the Arabian Peninsula, and potential pandemic disease. As of June 3, 2014, MERS CoV has reportedly infected 688 people and killed 282. We briefly summarize the state of the outbreak, and highlight unanswered questions and various explanations for the observed epidemiology.

Findings: The continuing but infrequent cases of MERS-CoV reported over the past two years have been puzzling and difficult to explain. The epidemiology of MERS-CoV, with many sporadic cases and a few hospital outbreaks, yet no sustained epidemic, suggests a low reproductive number. Furthermore, a clear source of infection to humans remains unknown. Also puzzling is the fact that MERS-CoV has been present in Saudi Arabia over several mass gatherings, including the 2012 and 2013 Hajj and Umrah pilgrimages, which predispose to epidemics, without an epidemic arising.

Conclusions

The observed epidemiology of MERS-CoV is quite distinct and does not clearly fit either a sporadic or epidemic pattern. Possible explanations of the unusual features of the epidemiology of MERS-CoV include sporadic ongoing infections from a non-human source; human to human transmission with a large proportion of undetected cases; or a combination of both. The virus has been identified in camels; however the mode of transmission of the virus to humans remains unknown, and many cases have no history of animal contact. A better understanding of the epidemiology of MERS CoV warrants further investigation.

The complete article is available as a provisional PDF. The fully formatted PDF and HTML versions are in production.

Wednesday, May 28, 2014

BMC Medicine: Comparison of Official, Public & `Crowd Sourced’ H7N9 Line Lists

 image

Figure 1 - Source BMC Medicine


# 8673


The internet has provided new and more efficient ways to accrue, organize, and access epidemiological data and has spawned multiple projects to identify, quantify, and dissect disease outbreaks. 


Over the year’s we’ve looked at a number of these projects, including the efforts of volunteer flu forums (including FluTrackers & The Flu Wiki), crowd-sourced data-gathering platforms like Flu Near YouHealthmap, ProMed Mail, and  Google’s Flu Trends, and of course the analysis and work product of scientist-bloggers like Dr. Ian Mackay, Andrew Rambaut, and Maia Majumder.


Last April, ECDC director Marc Sprenger noted the contribution of these, and other `crowd epidemic intelligence’ efforts online, in a Eurosurveillance  editorial called - Middle East Respiratory Syndrome coronavirus – two years into the epidemic  M Sprenger, D Coulombier – by writing:


Interestingly, over the past two years, voices on social media have been increasingly important for reports about the MERS-CoV situation as they have kept the topic high on the agenda of by raising pertinent questions, curating content on blogs, and reporting on cases in near-real time via Twitter. We have seen the MERS CoV debate on Twitter engage bloggers and journalists along with public health organisations, epidemiologists and doctors alike, often resulting in faster reporting and better understanding of the situation. This debate relates to a new phenomenon called ‘crowd epidemic intelligence’ [12] and is particularly important given the many unknowns about the MERS epidemic.


Regular readers of this blog are no doubt familiar with how often I refer to FluTracker’s MERS and H7N9 case lists, and so I was gratified to see among the references cited in this article was:


Of course, FluTrackers maintains just one of several such lists, which brings us to a new study – published today in BMC Medicine – that  compares  the `official’ Chinese CDC line list of H7N9 cases to 5 publicly-sourced listings:

  • Health Map
  • Virginia  Tech
  • Bloomberg  News
  • The University of Hong Kong
  • FluTrackers

This is an open-access study, so follow the link to read it in its entirety:

Accuracy of epidemiological inferences based on publicly available information: retrospective comparative analysis of line lists of human cases infected with influenza A(H7N9) in China


Eric HY Lau, Jiandong Zheng, Tim K Tsang, Qiaohong Liao, Bryan Lewis, John S Brownstein, Sharon Sanders, Jessica Y Wong, Sumiko R Mekaru, Caitlin Rivers, Peng Wu, Hui Jiang, Yu Li, Jianxing Yu, Qian Zhang, Zhaorui Chang, Fengfeng Liu, Zhibin Peng, Gabriel M Leung, Luzhao Feng, Benjamin J Cowling and Hongjie Yu


BMC Medicine 2014, 12:88 doi:10.1186/1741-7015-12-88
Published: 28 May 2014

Abstract


Background


Appropriate  public  health  responses  to  infectious  disease  threats  should  be  based  on  best available evidence,  which requires timely reliable data for appropriate  analysis. During the early stages of epidemics, analysis  of  ‘line  lists’  with  detailed  information  on  laboratory confirmed cases can provide important insights into the epidemiology of  a specific disease.


The  objective  of  the  present  study  was  to  investigate  the  extent to  which  reliable epidemiologic  inferences could  be  made  from  publicly-available  epidemiologic  data  of  human infection with influenza A(H7N9) virus.


Methods


We  collated  and  compared  six  different  line  lists  of  laboratory-confirmed  human  cases  of influenza A(H7N9) virus infection in the 2013 outbreak in China, including the official line list constructed by the Chinese Center for Disease Control and Prevention plus five other line lists  by  Health Map,  Virginia  Tech,  Bloomberg  News,  the  University  of  Hong  Kong  and FluTrackers, based on publicly-available information.

We characterized clinical severity and transmissibility  of  the  outbreak,  using  line  lists  available  at specific dates to estimate epidemiologic parameters, to replicate real-time inferences on the hospitalization fatality risk, and the impact of live poultry market closure.


Results


Demographic information was mostly complete (less than 10% missing for all variables) in different  line  lists,  but  there  were  more  missing  data  on  dates  of hospitalization,  discharge and  health  status  (more  than  10%  missing  for  each  variable).  The  estimated  onset  to hospitalization  distributions  were  similar  (median  ranged  from  4.6  to  5.6  days)  for  all  line lists. Hospital fatality risk was consistently around 20% in the early phase of the epidemic for all line lists and approached the final estimate of 35% afterwards for the official line list only.

Most of the line lists estimated >90% reduction in incidence rates after live poultry market closures in Shanghai, Nanjing and Hangzhou.


Conclusions


We demonstrated that analysis of  publicly-available data on H7N9 permitted  reliable assessment of  transmissibility and  geographical  dispersion,  while  assessment of clinical severity was less straightforward. Our results highlight the potential value in constructing a minimum  dataset  with  standardized  format  and  definition,  and  regular  updates  of  patient status. Such an approach could be particularly useful for diseases that spread across multiple countries.

(Continue . . . )

Friday, November 29, 2013

BMC Medicine: Containing Laboratory Escape Of Pandemic Viruses

image

BSL-4 Lab Worker - Photo Credit –USAMRIID


# 8017


While nobody really knows how the H1N1 influenza virus – absent in the human population for 20 years – managed to spark a pseudo-pandemic in 1977,  many researchers suspect it escaped a lab in either Russia or China in the mid-1970s.  Genetically, it was very similar to a strain that had circulated 2 decades earlier, something that would be difficult to occur in the wild, but might well  be explained had the virus been stored in a lab freezer (see EID Journal article Influenza Pandemics of the 20th Century Edwin D. Kilbourne).


The evidence is only circumstantial, so we may never know the truth of the matter.


With the rise of `Gain of Function’  (GOF) research – which aims to enhance the virulence, host range, or transmissibility of dangerous pathogens so that we may better understand their pandemic potential – biosecurity experts have warned that an accident at a BSL-3 or BSL-4 lab could have global ramifications (see mBio: The H5N1 Biosafety Level Debate).


While most researchers involved in this sort of work call the risks both manageable, and negligible, the truth is - lab accidents have occurred in the past, and despite very strict bio-safety rules and procedures, they are likely to happen again in the future. 


In 2009, the United States GAO issued a 104 page report (HIGH-CONTAINMENT LABORATORIES : National Strategy for Oversight Is Needed ) that looked at four high-profile biosecurity breeches {see below), and examined the risks of future lab accidents.


  • Alleged insider misuse of a select agent and laboratory;
  • Texas A&M University’s (TAMU) failure to report to CDC exposures to select agents in 2006
  • Power outages at CDC’s high-containment laboratories in 2007 and 2008
  • The release of foot-and-mouth disease virus in 2007 at the Pirbright facility in the U.K.


The GAO described the risks going forward (bolding mine):


Four highly publicized incidents in high-containment laboratories,  as well as evidence in scientific literature, demonstrate that (1) while laboratory accidents are rare, they do occur, primarily due to human error or systems (management and technical operations) failure, including the failure of safety equipment and procedures, (2) insiders can pose a risk, and (3) it is difficult to control inventories of biological agents with currently available technologies. Taken as a whole, these incidents demonstrate failures of systems and procedures meant to maintain biosafety and biosecurity in high-containment laboratories. For example, they revealed the failure to comply with regulatory requirements, safety measures that were not commensurate with the level of risk to public health posed by laboratory workers and pathogens in the laboratories, and the failure to fund ongoing facility maintenance and monitor the operational effectiveness of laboratory physical infrastructure.


At one of the most secure BSL-4 facilities in the world – USAMRIID (U.S. Army Medical Research Institute of Infectious Diseases) - their safety record is exceedingly good  . . .  but it is not perfect.  This (bolding mine) from their website:


In order to properly assess safety performance over time, USAMRIID compares the number of incidents to the number of times employees entered BSL-3 and BSL-4 laboratories in a given year.  It is important to note that in every incident from 2010-2012, no symptoms were reported and there were no signs of illness.

For instance, in 2012, USAMRIID had 20,402 entries into BSL-3 laboratories. During that time, there were 9 safety incidents within those laboratories; 2 were Potential Biological Exposures (PBE).  A PBE means that some risk of exposure to infectious agents and/or toxins may have occurred, resulting in Occupational Health staff placing the personnel involved on precautionary medical surveillance.  No illness or disease occurred in either case. The 2012 incident rate for BSL-3 laboratories was 0.044 percent.

Looking at BSL-4 laboratories, USAMRIID had 9,154 entries during 2012, with a total of 30 incidents including 6 Potential Biological Exposures (PBE).  A PBE means that some risk of exposure to infectious agents and/or toxins may have occurred, resulting in Occupational Health staff placing the personnel involved on precautionary medical surveillance.  In every case, no illness or disease occurred.  The 2012 incident rate for BSL-4 laboratories was 0.328 percent.


In 2011 CIDRAP NEWS published a report called:


Report: 395 mishaps at US labs risked releasing select agents

By Robert Roos

Sep 28, 2011 (CIDRAP News) – US government laboratories had 395 incidents that involved the potential release of select agents between 2003 and 2009, though only seven related infections were reported, according to a new National Research Council (NRC) report.

The accidents, including animal bites, needle sticks, and other mishaps, are mentioned briefly in an NRC report on the plans for a risk assessment for an Army biodefense lab to be built at Ft. Detrick in Frederick, Md.

"The Centers for Disease Control and Prevention (CDC) reports 395 cases of potential release events at national laboratories working with select agents," the report says.

"Seven LAIs [laboratory-acquired infections] were reported to CDC; four infections involved Brucella melitensis, two involved Francisella tularensis, and one involved an unspecified Coccidioides species," it continues. "CDC plans to publish an analysis of these events." The report does not list the outcomes of the infections.

(Continue . . . )

All of which serves as prelude to a report that was published yesterday in BMC Medicine, that models the ability of a research lab to detect and contain a potentially dangerous biosecurity breech, once it has occurred.


Containing the accidental laboratory escape of potential pandemic influenza viruses

Stefano Merler, Marco Ajelli, Laura Fumanelli and Alessandro Vespignani

BMC Medicine 2013, 11:252  doi:10.1186/1741-7015-11-252

Published: 28 November 2013

Abstract (provisional)

Background

The recent work on the modified H5N1 has stirred an intense debate on the risk associated with the accidental release from biosafety laboratory of potential pandemic pathogens. Here, we assess the risk that the accidental escape of a novel transmissible influenza strain would not be contained in the local community.

Methods

We develop here a detailed agent-based model that specifically considers laboratory workers and their contacts in microsimulations of the epidemic onset. We consider the following non-pharmaceutical interventions: isolation of the laboratory, laboratory workers' household quarantine, contact tracing of cases and subsequent household quarantine of identified secondary cases, and school and workplace closure both preventive and reactive.

Results

Model simulations suggest that there is a non-negligible probability (5% to 15%), strongly dependent on reproduction number and probability of developing clinical symptoms, that the escape event is not detected at all. We find that the containment depends on the timely implementation of non-pharmaceutical interventions and contact tracing and it may be effective (>90% probability per event) only for pathogens with moderate transmissibility (reproductive number no larger than R0 = 1.5). Containment depends on population density and structure as well, with a probability of giving rise to a global event that is three to five times lower in rural areas.

Conclusions

Results suggest that controllability of escape events is not guaranteed and, given the rapid increase of biosafety laboratories worldwide, this poses a serious threat to human health. Our findings may be relevant to policy makers when designing adequate preparedness plans and may have important implications for determining the location of new biosafety laboratories worldwide.

(Continue . . . . )

From a press release via Northeastern University, we get additional background on this research.  Follow the link to read it in its entirety, as I’ve only included an excerpt:


The potential pandemic

November 28, 2013 by Angela Herring

(EXCERPT)

The results of the sim­u­la­tion sug­gest a 5–15 per­cent chance that an acci­dental escape would not be detected, espe­cially in the case of very trans­mis­sible viruses and those where symp­toms are not imme­di­ately spotted. In addi­tion, they found that con­tain­ment would depend on the struc­ture and den­sity of the local pop­u­la­tion sur­rounding a facility.


“Most BSL labs are in big urban areas,” Vespig­nani explained. “In those areas we show that the prob­a­bility of not con­taining the out­break is three to five times larger than what it would be in iso­lated areas.”


While the prob­a­bility of acci­dental release is extremely low—there’s only 0.3 per­cent chance of a virus escaping one of these labs each year—even a single event can trans­late into a vast public health emer­gency, said Ste­fano Merler, one of the researchers who is based at the Kessler Foun­da­tion. More­over, the number of BSL3 and 4 lab­o­ra­to­ries is increasing, cre­ating a greater com­bined risk the world over.

(Continue . . . )


While there are only a few dozen BSL-4 labs around the world, there are literally thousands of BSL-3 capable labs. Admittedly, few are conducting GOF research, but even the release of an un-enhanced pathogen could potentially produce a huge impact.


Although many researchers can justifiably point out their lab’s exemplary safety record, the standards set and met in labs around the world can vary substantially.  And even the finest biosecurity methods can be thwarted by deliberate `bad acts’ by staff.  


Whether researchers doing this sort of research like to admit it it, the risks of seeing an accidental release from one of these labs is far from zero. While a .3% chance of release from any given lab works out to be roughly one every 100 years, with hundreds of of BSL-3 and BSL-4 labs around the world, the odds of seeing an accident in any given year somewhere in the world go up substantially.

.

And if today’s BMC Medicine study is correct, containment – particularly of a high R0 pathogen (highly infectious) – is far from guaranteed.

Sunday, October 13, 2013

Aye, There’s The Rub


image

Photo Credit – CDC


# 7854


Over the past decade, alcohol-based hand sanitizers have become ubiquitous in modern society  – both in medical facilities, and in the pockets and purses of millions of people. Their popularity stems from the fact that they are quick and easy to use, require no water or wash basin, and in many scenarios offer pretty good protection against germs.


While they are not always an appropriate substitute for a good old-fashioned soap & water hand scrubbing - particularly when dealing with C. difficile (see CDC C. Diff FAQ) or Norovirus (see CMAJ: Hand Sanitizers May Be `Suboptimal’ For Preventing Norovirus) - I confess, I keep a bottle handy almost everywhere I go. 


And I use it often.


image

With Global Handwashing Day just two days away, and cold & flu season upon us,  it is good timing that a study just published in BMC Infectious Disease looks at the efficacy of using alcohol hand sanitizers, focusing in particular on how much sanitizer is really needed to do a good job. 


And as it turns out, if you follow the directions on the bottle, you may not be getting the degree of disinfection you believe.  The following figure shows a composite (across 15 subjects) of areas of the hands that escaped sanitation during one of the trials conducted using the the manufacturer’s recommended quantity of product (1.1 ml).


image


It turns out that while alcohol based sanitizers work well against most common pathogens, the quantity of product recommended by many manufacturers (typically 1.1 ml, or a `single pump’ from the dispenser) provides inadequate coverage (both in terms of skin area and contact time) to meet current ASTM efficacy standards.


A `double-pump’ (ie. > 2 ml) provided not only better skin coverage, but longer contact time, resulting in a much greater reduction of skin contamination – meeting or exceeding  ASTM and  FDA efficacy standards.


A link to the study, along with some excerpts, then I’ll be back with a bit more.


Less and less–influence of volume on hand coverage and bactericidal efficacy in hand disinfection

Günter Kampf12*, Sigunde Ruselack3, Sven Eggerstedt3, Nicolas Nowak4 and Muhammad Bashir5

BMC Infectious Diseases 2013, 13:472 doi:10.1186/1471-2334-13-472

The electronic version of this article is the complete one and can be found online at: http://www.biomedcentral.com/1471-2334/13/472

Abstract

Background

Some manufacturers recommend using 1.1 mL per application of alcohol-based handrubs for effective hand disinfection. However, whether this volume is sufficient to cover both hands, as recommended by the World Health Organization, and fulfills current efficacy standards is unknown. This study aimed to determine hand coverage for three handrubs (two gels based on 70% v/v and 85% w/w ethanol and a foam based on 70% v/v ethanol) applied at various volumes.

Methods

Products were tested at product volumes of 1.1 mL, 2 mL, 2.4 mL as well as 1 and 2 pump dispenser pushes; the foam product was tested in addition at foam volumes of 1.1 mL, 2 mL, and 2.4 mL. Products were supplemented with a fluorescent dye and 15 participants applied products using responsible application techniques without any specific steps but the aim of completely covering both hands. Coverage quality was determined under ultraviolet light by two blinded investigators. Efficacy of the three handrubs was determined according to ASTM E 1174-06 and ASTM E 2755-10. For each experiment, the hands of 12 participants were contaminated with Serratia marcescens and the products applied as recommended (1.1 mL for 70% v/v ethanol products; 2 mL for the 85% w/w ethanol product). Log10-reduction was calculated.

Results

Volumes < 2 mL yielded high rates of incomplete coverage (67%–87%) whereas volumes ≥ 2 mL gave lower rates (13%–53%). Differences in coverage were significant between the five volumes tested for all handrubs (p < 0.001; two-way ANOVA) but not between the three handrubs themselves (p = 0.796). Application of 1.1 mL of 70% v/v ethanol rubs reduced contamination by 1.85 log10 or 1.60 log10 (ASTM E 1174-06); this failed the US FDA efficacy requirement of at least 2 log10. Application of 2 mL of the 85% w/w ethanol rub reduced contamination by 2.06 log10 (ASTM E 1174-06), fulfilling the US FDA efficacy requirement. Similar results were obtained according to ASTM E 2755-10.

Conclusions

Our data indicated that handrubs based on 70% ethanol (v/v) with a recommended volume of 1.1 mL per application do not ensure complete coverage of both hands and do not achieve current ASTM efficacy standards.


Actually, the entire (open access) study is worth reading, but for those not particularly interested in methods and materials, the Discussion at the end wraps things up nicely.  


As a former paramedic - I was, and still am - fanatical about hand hygiene. So we’ve looked at the topic of hand washing, and Hospital Acquired Infections (HAIs) often.


Last June, in The Great Unwashed, we looked at a Michigan State University study that found only about 5% of people who were observed in public restrooms washed their hands effectively.   While in Before You Ask To Borrow Someone’s Cell Phone . . . we looked at the degree of fecal (and other) contamination on fomites (inanimate objects like cell phones, keyboards, credit cards, money . . . )


We live in a germy world, and you don’t have to work in a hospital or a doctor’s office to be concerned with good hand hygiene.


For more on all of this I’d invite you to visit:


http://www.globalhandwashingday.org/


And the CDC’s hand hygiene website, where you will find many resources, including a link to a new iPad/iPhone application called iScrub.


image


Wednesday, October 02, 2013

BMC: Estimating The Transmission Potential Of H7N9

image

Credit CDC


# 7829


The yardstick by which the epidemic potential of a virus is measured is called the R0 (R naught) or Basic Reproductive Number. Essentially, the number of new cases in a susceptible population likely to arise from a single infection.

With an  R0  below 1.0, a virus (as an epidemic) begins to sputter and dies out. 

Above 1.0, and an epidemic can have `legs’.


Some viruses have extremely high  R0s.  Measles and pertussis are extremely communicable, and fall between 12 and 18.   In comparison, seasonal influenza runs from about 1.7 to to 2.1 (cite Quantifying the transmissibility of human influenza and its seasonal variation in temperate regions).


The  R0  can be difficult to gauge properly, particularly very early in an outbreak, because it requires a lot of good epidemiological data. Often unknown (at least until serological studies can be conducted) is the rate of mild or asymptomatic infection with a virus, and that can skew the results. The R0  can also vary  with time, meaning that the transmissibility of a virus today may be different from its transmissibility next week, or next month.


Still, even with these limitations, estimates of the R0  can help us understand the epidemic (or even pandemic) potential of a virus.


Which brings us to an open access study, that appears in BMC Medicine  (h/t Sharon Sanders on FluTrackers), that looks at the transmission potential of the H7N9 virus,  using confirmed cases from last spring.  The authors – based on the 132 lab confirmed cases  - estimate the virus to have a low R0 -  well below 1.0 – suggesting a low epidemic potential. 


Encouraging results, although there remains significant uncertainty over the total number of H7N9 infections in China last spring (I’ll return with more on that potential complication, after the abstract).


Transmission potential of influenza A/H7N9, February to May 2013, China

Gerardo Chowell, Lone Simonsen, Sherry Towers, Mark A Miller and Cécile Viboud

Background

On 31 March 2013, the first human infections with the novel influenza A/H7N9 virus were reported in Eastern China. The outbreak expanded rapidly in geographic scope and size, with a total of 132 laboratory-confirmed cases reported by 3 June 2013, in 10 Chinese provinces and Taiwan. The incidence of A/H7N9 cases has stalled in recent weeks, presumably as a consequence of live bird market closures in the most heavily affected areas. Here we compare the transmission potential of influenza A/H7N9 with that of other emerging pathogens and evaluate the impact of intervention measures in an effort to guide pandemic preparedness.

<SNIP>

Results

Estimates of R for the A/H7N9 outbreak were below the epidemic threshold required for sustained human-to-human transmission and remained near 0.1 throughout the study period, with broad 95% credible intervals by the Bayesian method (0.01 to 0.49). The Bayesian estimation approach was dominated by the prior distribution, however, due to relatively little information contained in the case data. We observe a statistically significant deceleration in growth rate after 6 April 2013, which is consistent with a reduction in A/H7N9 transmission associated with the preemptive closure of live bird markets. Although confidence intervals are broad, the estimated transmission potential of A/H7N9 appears lower than that of recent zoonotic threats, including avian influenza A/H5N1, swine influenza H3N2sw and Nipah virus.

Conclusion

Although uncertainty remains high in R estimates for H7N9 due to limited epidemiological information, all available evidence points to a low transmission potential. Continued monitoring of the transmission potential of A/H7N9 is critical in the coming months as intervention measures may be relaxed and seasonal factors could promote disease transmission in colder months.

The complete article is available as a provisional PDF. The fully formatted PDF and HTML versions are in production.


Addressing some of the uncertainties in their calculations, the authors write:

Information regarding the reservoir of A/H7N9 and the natural history of this disease is still limited, as would be the case for any emerging zoonosis with limited prior experience. It is intriguing that 23% of A/H7N9 cases do not report any prior contact with poultry (suggesting R is approximately 0.23), and yet clusters are extremely infrequent (suggesting R closer to 0).

These conflicting findings could be reconciled with additional information on the prevalence of asymptomatic infections; unfortunately, recent serological information is currently lacking. Overall, all R estimation methods tend to produce high uncertain ranges for A/H7N9.


Regular readers of this blog are aware that over the summer, we saw several studies that estimated the likely number of H7N9 cases to be much higher than the 132 laboratory confirmed cases used in this analysis. The problem is, with just about every illness or infection, only a fraction of the cases – usually the most severe – are identified.


And it doesn’t matter whether we are talking about seasonal influenza, West Nile Virus, Salmonella, or avian flu.

surveillance


Last April, in H7N9: Trying To Define The Size Of The Iceberg, University of Hong Kong researchers announced that they believed the actual number of cases was at least twice the number being reported.  This from Bloomberg News.


H7N9 Cases May Be Double Known Figure, Hong Kong Researchers Say

By Natasha Khan - Apr 22, 2013 3:46 AM ET

H7N9 bird flu may have infected twice as many people as the 103 cases reported, an analysis by researchers at the University of Hong Kong showed.

(Continue . . . )


A few weeks later, the Eurosurveillance Journal  carried a rapid communications from researchers at the University of Hong Kong, where they announced the likely number of cases to be several times higher than reported.


8, Issue 19, 09 May 2013

Preliminary inferences on the age-specific seriousness of human disease caused by avian influenza A(H7N9) infections in China, March to April 2013

B J Cowling , G Freeman, J Y Wong, P Wu, Q Liao, E H Lau, J T Wu, R Fielding, G M Leung

Between 31 March and 21 April 2013, 102 laboratory-confirmed influenza A(H7N9) infections have been reported in six provinces of China. Using survey data on age-specific rates of exposure to live poultry in China, we estimated that risk of serious illness after infection is 5.1 times higher in persons 65 years and older versus younger ages.

Our results suggest that many unidentified mild influenza A(H7N9) infections may have occurred, with a lower bound of 210–550 infections to date.

(Continue . . .)


By mid-summer, another analysis (by the same researchers) appeared in The Lancet (see Lancet: Clinical Severity Of Human H7N9 Infection) that substantially raised their estimate of the total number of H7N9 cases in China.  In this new study (after citing many limitations to the data) they write:


Our estimate that between 1500 and 27 000 symptomatic infections with avian influenza A H7N9 virus might have occurred as of May 28, 2013, is much larger than the number of laboratory-confirmed cases.


Admittedly a wide range, and without comprehensive serological studies, impossible to prove one way or the other.  If I had to guess, my money would be on the lower end of the range. But that’s strictly a guess on my part.


And that’s the rub.  Without really good data, we are forced to make assumptions. And if the data is incomplete, or the assumptions wrong, that can skew the results.


Ambiguities aside, the fact that only a few small clusters were documented and we haven’t seen ongoing transmission of the virus over the summer, makes for a pretty good prima facie case that the virus’ Rlast spring was less than 1.0.


Whether the virus retains this low R0, or becomes better adapted to mammalian hosts in the days, weeks, or months ahead is the question that keeps public health officials up at night.

Tuesday, September 24, 2013

BMC Infectious Diseases: Waning Flu Vaccine Protection In the Elderly


image


# 7807


The standard advice for getting the seasonal flu vaccine is to get it as soon as it becomes available in the fall, as explained in the following excerpt from the CDC’s Misconceptions about Seasonal Flu and Flu Vaccines (updated May 2013).


Should I wait to get vaccinated so that my immunity lasts through the end of the season?

No. CDC recommends that influenza vaccination begin as soon as flu vaccine becomes available and continues throughout the flu season. The flu season is unpredictable, and since it takes about two weeks after vaccination for antibodies to develop in the body that protect against influenza virus infection, it is best that people get vaccinated early so they are protected before influenza begins spreading in their community. While immunity can vary by person, previously published studies suggest that immunity lasts through a full flu season. Although adults 65 and older typically have a reduced immune response to flu vaccination compared with young healthy adults, their immune protection still extends through one flu season. In addition, a review of published studies concluded that no clear evidence exists that immunity declines more rapidly in the elderly. Note: The high-dose vaccine for people aged 65 and older is intended to create a stronger immune response in this age group.


Challenging this conventional wisdom is a new study that appears in BMC Infectious Diseases that finds – at least among those over the age of 65 – the protective effects of a flu shot begins to diminish rapidly after four months.  This study, which was conducted in Spain, involved  a relatively small group of subjects, and so its results must be interpreted with caution.


First a link to the open access study, followed by a link to a CIDRAP NEWS article which nicely summarizes the results, after which I’ll return with more.


Effectiveness of influenza vaccine against laboratory-confirmed influenza, in the late 2011--2012 season in Spain, among population targeted for vaccination

Silvia Jiménez-Jorge, Salvador de Mateo, Concha Delgado-Sanz, Francisco Pozo, Inmaculada Casas, Manuel Garcia-Cenoz, Jesús Castilla, Esteban Pérez, Virtudes Gallardo, Carolina Rodriguez, Tomás Vega, Carmen Quiñones, Eva Martínez, Juana María Vanrell, Jaume Giménez, Daniel Castrillejo, María del Serrano, Julián Mauro Ramos and Amparo Larrauri

Abstract (provisional)
Background

In Spain, the influenza vaccine effectiveness (VE) was estimated in the last four seasons using the observational study cycEVA conducted in the frame of the existing Spanish Influenza Sentinel Surveillance System. To estimate influenza vaccine effectiveness (VE) against medically attended, laboratory-confirmed influenza-like illness (ILI) among the target groups for vaccination in Spain in the 2011--2012 season. We also studied influenza VE in the early (weeks 52/2011-7/2012) and late (weeks 8-14/2012) phases of the epidemic and according to time since vaccination.

Methods

Medically attended patients with ILI were systematically swabbed to collect information on exposure, laboratory outcome and confounding factors. Patients belonging to target groups for vaccination and who were swabbed <8 days after symptom onset were included. Cases tested positive for influenza and controls tested negative for any influenza virus. To examine the effect of a late season, analyses were performed according to the phase of the season and according to the time between vaccination and symptoms onset.

Results

The overall adjusted influenza VE against A(H3N2) was 45% (95% CI, 0--69). The estimated influenza VE was 52% (95% CI, -3 to 78), 40% (95% CI, -40 to 74) and 22% (95% CI, -135 to 74) at 3.5 months, 3.5-4 months, and >4 months, respectively, since vaccination. A decrease in VE with time since vaccination was only observed in individuals aged >= 65 years. Regarding the phase of the season, decreasing point estimates were only observed in the early phase, whereas very low or null estimates were obtained in the late phase for the shortest time interval.

Conclusions

The 2011--2012 influenza vaccine showed a low-to-moderate protective effect against medically attended, laboratory-confirmed influenza in the target groups for vaccination, in a late season and with a limited match between the vaccine and circulating strains. The suggested decrease in influenza VE with time since vaccination was mostly observed in the elderly population. The decreasing protective effect of the vaccine in the late part of the season could be related to waning vaccine protection because no viral changes were identified throughout the season.

From CIDRAP NEWS.

Study: Flu vaccine effectiveness may drop within a few months

The effectiveness of the influenza vaccine dropped from 52% at 3.5 months after vaccination to 22% more than 4 months after vaccination during the 2011-12 season, according to a study out of Spain today in BMC Infectious Diseases whose power was limited by a small sample size.


Researchers analyzed data from 342 primary care patients across the country who had influenza-like illness and for whom vaccination status and timing were known. Of these, 226 had lab-confirmed flu and 116 served as test-negative controls.

<SNIP>

The waning immunity appeared to be entirely tied to immune response in elderly patients. The researchers found the adjusted VE dropped from 85% (95% CI, 18 to 97) for patients older than 65 who were vaccinated 3 months before symptom onset to a null estimate for those in that age-group who were vaccinated more than 4 months before symptom onset. The trend, however, was not statistically significant.

The team did not find decreased VE with time in patients younger than 65 years.

(Continue . . . )


In the interest of full disclosure, I get the flu vaccine every year and I’ve already had mine earlier this month (see NPM13: Giving Preparedness A Shot In The Arm), yet I’m fully aware that flu vaccines are not a panacea against influenza.  


As we’ve discussed often, flu vaccines – while considered very safe – most years only offer a moderate level of protection against influenza, and that their VE (vaccine effectiveness) can vary widely between flu shot recipients, and is often substantially reduced among those older than 65 or with immune problems.


As an example, in October of 2011, in CIDRAP: A Comprehensive Flu Vaccine Effectiveness Meta-Analysis, we saw a major review indicating the TIV (Trivalent Influenza Vaccine) - during 8 of 12 flu seasons (67%) – produced a combined efficacy of only 59% among healthy adults (aged 18–65 years).


They found the protective effects of the flu vaccine could vary considerably from one season to the next, as well as among different age groups (see Study: Flu Vaccines And The Elderly).


Still, given their safety record, and relative low cost, I consider them to be good insurance against what can sometimes be a serious illness – particularly as I’m getting older.  As an added incentive, we recently saw a study - that while far from conclusive - suggesting that the Flu Vaccine May Reduce Heart Attack Risk.


There is no doubt there is a pressing need for better flu vaccines (see CIDRAP: The Need For `Game Changing’ Flu Vaccines) - but until they can be developed - the flu shots we have –  when coupled with good `flu hygiene’ (washing hands, covering coughs, staying home when ill)  remain the best preventative actions you can take against the flu.

Sunday, June 23, 2013

BMC Public Health: H5N1 In Indonesia, Diagnosis, Treatment & CFR

image


# 7422


One of the enigmas surrounding the H5N1 virus is the wide disparity in fatality rates between countries. As you can see from the chart above, Indonesia’s CFR (Case Fatality Ratio) is more than twice that of Egypt.


Of the nations that have reported cases, Bangladesh has the best record, with only a 14% fatality rate.


Granted, these numbers are likely skewed by differences in surveillance, testing, and reporting around the world, but they are what we have to work with.


One of the unknowns is the relative health impact of different clades of the H5N1 virus (until recently, Indonesia had only dealt with clades 2.1.1, 2.1.2. and 2.1.3, but now adds 2.3.2. – while clades 2.2.1 and 2.2 are endemic in Egypt).


But other factors have been posited, including delays in seeking healthcare and, once sought, the speed and quality of diagnosis and treatment.


A study, recently published in BMC Public Health, looks at the treatment and outcome of 124 cases of H5N1 infection reported in Indonesia between 2005 and 2010, and finds serious delays in the time between seeking medical treatment and an accurate diagnosis and antiviral treatment for the virus.


Human influenza A H5N1 in Indonesia: health care service-associated delays in treatment initiation

Wiku Adisasmito, Dewi Nur Aisyah, Tjandra Yoga Aditama, Rita Kusriastuti, ¿ Trihono, Agus Suwandono, Ondri Dwi Sampurno, ¿ Prasenohadi, Nurshanty A Sapada, MJN Mamahit, Anna Swenson, Nancy A Dreyer and Richard Coker

BMC Public Health 2013, 13:571 doi:10.1186/1471-2458-13-571

Published: 11 June 2013

Abstract (provisional)
Background

Indonesia has had more recorded human cases of influenza A H5N1 than any other country, with one of the world's highest case fatality rates. Understanding barriers to treatment may help ensure life-saving influenza-specific treatment is provided early enough to meaningfully improve clinical outcomes.

Methods

Data for this observational study of humans infected with influenza A H5N1 were obtained primarily from Ministry of Health, Provincial and District Health Office clinical records. Data included time from symptom onset to presentation for medical care, source of medical care provided, influenza virology, time to initiation of influenza-specific treatment with antiviral drugs, and survival.

Results

Data on 124 human cases of virologically confirmed avian influenza were collected between September 2005 and December 2010, representing 73% of all reported Indonesia cases. The median time from health service presentation to antiviral drug initiation was 7.0 days. Time to viral testing was highly correlated with starting antiviral treatment (p < 0.0001). We found substantial variability in the time to viral testing (p = 0.04) by type of medical care provider. Antivirals were started promptly after diagnosis (median 0 days).

Conclusions

Delays in the delivery of appropriate care to human cases of avian influenza H5N1 in Indonesia appear related to delays in diagnosis rather than presentation to health care settings. Either cases are not suspected of being H5N1 cases until nearly one week after presenting for medical care, or viral testing and/or antiviral treatment is not available where patients are presenting for care. Health system delays have increased since 2007.

The complete article is available as a provisional PDF. The fully formatted PDF and HTML versions are in production.


The therapeutic effects of antivirals, like oseltamivir, are the most pronounced in the first 48 hours of infection. After that, some benefit may be derived, but its effects are greatly diminished.


In Indonesia, this study found the average time between seeking medical treatment, and receipt of antivirals, was 7 days.  Too late to have much effect.


The authors write in the discussion section:


A low clinical suspicion of disease by health care workers likely remains an important impediment to early diagnosis, virological confirmation, and appropriate treatment initiation [13].


The signs and symptoms during the first two days of disease in cases reported here were mostly non-specific. This nonspecific clinical presentation of influenza A (H5N1) disease raises challenges.


The differential diagnosis of cases may include other influenza-like illnesses, dengue, or typhoid [14], to the exclusion of influenza A (H5N1). In an earlier report, only 12% of influenza H5N1 cases were initially diagnosed as having influenza H5N1
[13].


There’s a good deal of data included in this report, including demographic information on cases, CFRs based on the type of medical facility where patients were first seen, and a detailed list - by patient symptoms – of the time to seeking medical care, time to testing, and time to antiviral treatment. 


The authors conclude by writing:


Conclusions


Reducing health care system delays in the initiation of specific treatment for patients infected with influenza H5N1 is no easy matter. The non-specific nature of  the disease, especially in the early days, suggests a number of options that might be considered.


The application of rapid diagnostic tests on presentation to confirm or refute the diagnosis might enable clinicians to tailor their treatment better. Alternatively, the initiation of treatment when clinical suspicion is raised might offer benefits to the minority who actually have influenza H5N1.


Both of these approaches have cost implications that need to be determined. Prospective clinical studies too may offer more robust data on clinical symptoms and signs associated with differentiating H5N1 from other diseases as well as determining those likely to fare least well clinically and thus benefit most from influenza specific clinical interventions.

Thursday, December 13, 2012

BMC: Exploring The `Age Shift’ Of Pandemic Mortality


image

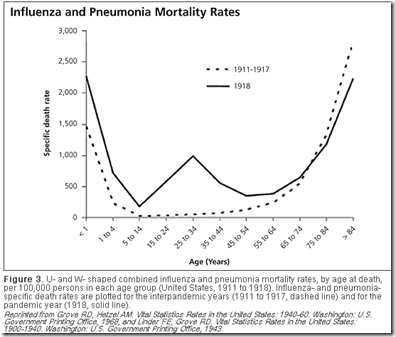
The infamous `W shaped curve’ of the 1918 pandemic clearly shows that the death rates among those in their teens, 20s, and 30s was much higher than was normally seen in previous influenza years. Those over the age of 65, however, saw a reduction in mortality during the pandemic.


# 6778


Seasonal influenza can strike people of any age, but exacts its greatest toll on the elderly – those over the age of 65 whose weaker immune systems (and comorbid conditions) often render them less able to fight off the infection.


Exact numbers remain elusive, since influenza is only rarely cited as the primary cause of death. If a cause of death (beyond`natural causes’) is given, comorbidities like COPD, heart disease, asthma are far more likely to listed on a death certificate.


Still, estimates are that 90% of seasonal flu mortality occurs in those over the age of 65 (cite CDC Pink book).


In 2010, (see Study: Years Of Life Lost Due To 2009 Pandemic), researchers estimated the median age of death due to seasonal influenza-related illness in the United States to be 76.


In contrast, pandemic influenza strains, at least during the first few years after their introduction, often produce a dramatic `age shift’ downward in mortality. 


The CDC’s estimate of average and median age of death due to the 2009 Pandemic virus reads:


Based on two CDC investigations of confirmed 2009 H1N1-related deaths that occurred during the spring and fall of 2009, the average age of people in the U.S. who died from 2009 H1N1 from April to July of 2009 was 40. The median age of death for this time period was 43. From September to October of 2009, the average age of people in the U.S. who died from 2009 H1N1 was 41, and the median age was 45.


Admittedly, younger fatalities are more likely to be investigated, and documented, than those that occur among the elderly, but still . . . this is a significant shift.


And it corresponds closely to the results of the Years Of Life Lost Study mentioned above, which found the mean age of death from the novel H1N1 virus to be half that of seasonal flu, or 37.4 years.


In terms of years of life lost (YLL), the average pandemic flu death has a many fold greater impact than the average seasonal flu fatality.   


This same pattern was repeated (to greater and lesser degrees) during the 1918, 1957, and 1968 pandemics  . . .  along with the 1977 return of the H1N1 virus after an absence of 20 years.


All of which has led to a good deal of speculation.


What drives this age shift?  Why were apparently healthy, younger flu victims, with robust immune systems more likely to die from pandemic flu?


Although not universally accepted, one popular theory has centered around the production of a `cytokine storm’, which is believed to be the product of a robust immune system typically found in younger, healthier individuals.


Cytokines are a category of signaling molecules that are used extensively in cellular communication. They are often released by immune cells that have encountered a pathogen, and are designed to alert and activate other immune cells to join in the fight against the invading pathogen.


This cascade of immune cells rushing to the site of infection, that if it races out of control, can literally kill the patient.


The patient’s lungs can fill with fluid (which makes a terrific medium for a bacterial co-infection), and cells in the lungs (Type 1 & Type II Pneumocytes) can sustain severe damage.


You can find more on this theory in these earlier posts:


Study: Calming The Cytokine Storm
Cytokine Storm Warnings

The Baskin Influenza Pathogenesis Study

Pt. 1               Pt. 2            Pt. 3


Another theory has held that older populations are more likely to have been exposed to a similar influenza strain in the past and are more likely to carry some level of immunity to the emerging pandemic strain.


This was clearly the case in 1977, when the H1N1 virus – supplanted by the H2N2 virus in 1957 – made an unexpected comeback.  Those born after the virus last circulated in the mid 1950s – were the hardest hit age group.


Again with the 2009 H1N1 pandemic virus, those born before the early 1950s appeared to have higher levels of immunity, resulting in fewer severe outcomes among older individuals.


All of which serves as prelude to a research article, published yesterday in BMC Medicine, that looks at the age shift during pandemic outbreaks.


The age distribution of mortality due to influenza: pandemic and peri-pandemic

Tom Reichert, Gerardo Chowell and Jonathan A McCullers

Background

Pandemic influenza is said to 'shift mortality' to younger age groups; but also to spare a subpopulation of the elderly population. Does one of these effects dominate? Might this have important ramifications?

Methods

We estimated age-specific excess mortality rates for all-years for which data were available in the 20th century for Australia, Canada, France, Japan, the UK, and the USA for people older than 44 years of age. We modeled variation with age, and standardized estimates to allow direct comparison across age groups and countries. Attack rate data for four pandemics were assembled.

Results

For nearly all seasons, an exponential model characterized mortality data extremely well; For seasons of emergence and a variable number of seasons following, however, a subpopulation above a threshold age invariably enjoyed reduced mortality. 'Immune escape', a stepwise increase in mortality among the oldest elderly, was observed a number of seasons after both the A(H2N2) and A(H3N2) pandemics. The number of seasons from emergence to escape varied by country. For the latter pandemic, mortality rates in four countries increased for younger age groups but only in the season following that of emergence. Adaptation to both emergent viruses was apparent as a progressive decrease in mortality rates, which, with two exceptions, was seen only in younger age groups. Pandemic attack rate variation with age was estimated to be similar across four pandemics with very different mortality impact.

Conclusions

In all influenza pandemics of the 20th century, emergent viruses resembled those that had circulated previously within the lifespan of then-living people. Such individuals were relatively immune to the emergent strain, but this immunity waned with mutation of the emergent virus. An immune subpopulation complicates and may invalidate vaccine trials. Pandemic influenza does not 'shift' mortality to younger age groups; rather, the mortality level is reset by the virulence of the emerging virus and is moderated by immunity of past experience. In this study, we found that after immune escape, older age groups showed no further mortality reduction, despite their being the principal target of conventional influenza vaccines. Vaccines incorporating variants of pandemic viruses seem to provide little benefit to those previously immune. If attack rates truly are similar across pandemics, it must be the case that immunity to the pandemic virus does not prevent infection, but only mitigates the consequences.

The complete article is available as a provisional PDF.


The entire article is worthy of your attention, and the authors delve into a good many areas, including future pandemic mitigation planning, and vaccine strategies. 


But essentially the authors propose that all recent influenza pandemics (over the past century) have involved `recycled’ flu strains to which some portion of the population had previously been exposed to.


They conclude:


Pandemics do not ‘shift’ mortality to younger ages

From this study, it is evident that pandemics do not ‘shift’ mortality to younger ages. Rather, the
entire mortality level is simply reset to the virulence level of the emergent virus. This reset is accompanied by immunoprotection in older age groups, which is determined by their level of previous experience with viruses similar to that emerging. 


In other words, were older populations not carrying some vestiges of immunity from previously flu encounters, these researchers suggest they would suffer the same levels (or higher) of mortality and morbidity as do younger populations.


The authors also point out that initial levels of immunity to emerging (or more properly, re-emerging) influenza viruses in older populations tends to wane in subsequent seasons, leading to what they call Immune Escape: `a stepwise increase in mortality among the oldest elderly’.


Does this blow the whole cytokine storm theory out of the water?


Not necessarily, although it does call into question just how much of an impact it has on the perceived `age shift’ in pandemic flu cases.


These two theories need not be mutually exclusive, however, and so I wouldn’t rule out the possibility that both may play a part in driving pandemic mortality demographics.