Showing posts with label JAMA. Show all posts

Wednesday, July 17, 2013

JAMA: The 2012 West Nile Encephalitis Epidemic in Dallas, Tx


image


# 7487

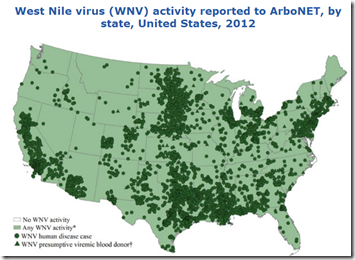
Although West Nile Virus (WNV) activity was high across much of the country in 2012, the hardest hit area was Dallas County, Texas, where at least 19 people died from the severe form of this mosquito borne infection called Neuroinvasive West Nile Disease.


Mild cases – called West Nile Fever – often go undiagnosed, with probably only 2%-3% being identified. You’ll find some of my coverage of last year’s outbreak in Texas in the following blogs:


CDC Telebriefing on West Nile Virus
Updating the Texas West Nile Outbreak
Dallas West Nile Update


Nationally, the CDC reported last May:


Final 2012 West Nile virus update:

In 2012, all 48 contiguous states, the District of Columbia, and Puerto Rico reported West Nile virus infections in people, birds, or mosquitoes. A total of 5,674 cases of West Nile virus disease in people, including 286 deaths, were reported to CDC. Of these, 2,873 (51%) were classified as neuroinvasive disease (such as meningitis or encephalitis) and 2,801 (49%) were classified as non-neuroinvasive disease. The numbers of neuroinvasive, non-neuroinvasive, and total West Nile virus disease cases reported in 2012 are the highest since 2003.


It is estimated that only about 20% of the people who are infected with WNV develop symptoms, and the vast majority of those only experience a mild flu-like illness. Accordingly, mild, asymptomatic, or non-neuroinvasive infections are likely vastly undercounted.


The more severe `neuroinvasive’ form of WNV can produce symptoms that include headache, stiff neck, confusion, coma, convulsions, and even paralysis.


According to the CDC’s WEST NILE SYMPTOMS Q&A page.


What are the symptoms of West Nile virus disease?

No symptoms in most people. Most people (70-80%) who become infected with West Nile virus do not develop any symptoms.


Febrile illness in some people. About 1 in 5 people who are infected will develop a fever with other symptoms such as headache, body aches, joint pains, vomiting, diarrhea, or rash. Most people with this type of West Nile virus disease recover completely, but fatigue and weakness can last for weeks or months.


Severe symptoms in a few people. Less than 1% of people who are infected will develop a serious neurologic illness such as encephalitis or meningitis (inflammation of the brain or surrounding tissues). The symptoms of neurologic illness can include headache, high fever, neck stiffness, disorientation, coma, tremors, seizures, or paralysis.


Recovery from severe disease may take several weeks or months. Some of the neurologic effects may be permanent. About 10 percent of people who develop neurologic infection due to West Nile virus will die.


Which brings us to a research article (which you can read in its entirety) that appeared in JAMA yesterday on the Dallas epidemic, that finds correlations between an unusually mild winter, the early detection of WNV bearing mosquitoes, and the likelihood of seeing a major WNV outbreak.


The 2012 West Nile Encephalitis Epidemic in Dallas, Texas FREE

Wendy M. Chung, MD, SM1; Christen M. Buseman, PhD, MPH1; Sibeso N. Joyner, MPH1; Sonya M. Hughes, MPH1; Thomas B. Fomby, PhD4; James P. Luby, MD2; Robert W. Haley, MD3

Conclusions and Relevance Large West Nile virus epidemics in Dallas County begin early after unusually warm winters, revisit similar geographical distributions, and are strongly predicted by the mosquito vector index. Consideration of weather patterns and historical geographical hot spots and acting on the vector index may help prevent West Nile virus–associated illness.


The outbreak, which reached its peak in early August, was eventually brought under control after aerial spraying began in week 32 (see chart below).

image


Despite some initial public concerns over the use of aerial insecticides, surveillance of local emergency rooms did not detect any increase in ER visits for respiratory symptoms or rashes following airborne spraying.


In addition to the study you’ll find a short (4 minute) video by Dr. WM Chung, lead author of the study. 


image


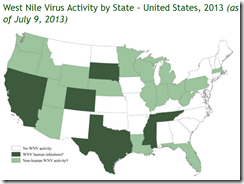
Although it is too early in the summer to know what kind of WNV season 2013 will bring, the CDC’s DVBID reports the following activity:
 

image

Preliminary Maps & Data for 2013

As of July 9, 2013, 25 states and the District of Columbia have reported West Nile virus infections in people, birds, or mosquitoes. A total of 14 cases of West Nile virus disease in people, including two deaths, have been reported to CDC. Of these, five (36%) were classified as neuroinvasive disease (such as meningitis or encephalitis) and nine (64%) were classified as non-neuroinvasive disease.


Which is why health departments across the nation urge people to follow the `5 D’s’ of mosquito protection:

image

Thursday, May 09, 2013

JAMA: Challenges Of Producing An Effective & Timely H7N9 Vaccine

image


# 7256


In just about every movie or TV show that features a deadly pandemic outbreak - when all seems about lost - noble lab-weary scientists roll out a last-minute experimental vaccine and save the world.  


Cue dramatic music, roll credits.


Given the reality of vaccine production and distribution, this is the modern equivalent of having a deity descend from the rafters in the final act of a Greek Play to conveniently dispatch any unsolvable problems; a Deus ex Machina (Latin: "god from the machine").


As we’ve discussed before, the logistics of producing and deploying a pandemic vaccine in sufficient quantity, and in time to have a major effect on an outbreak, are enormous (see H7N9 Vaccine Realities).


And as we learn from an analysis that appears in JAMA today - penned by  CIDRAP’s  Michael T. Osterholm, PhD, MPH; Katie S. Ballering, PhD; and Nicholas S. Kelley, PhD – the obstacles facing the production of an H7N9 vaccine are likely to be even greater still.


Rather than try to pick and choose excerpts, I would invite you to follow the link and read:


Major Challenges in Providing an Effective and Timely Pandemic Vaccine for Influenza A(H7N9)

Michael T. Osterholm, PhD, MPH; Katie S. Ballering, PhD; Nicholas S. Kelley, PhD

JAMA. 2013;():1-2. doi:10.1001/jama.2013.6589.

Published online May 9, 2013

The emergence of avian influenza A(H7N9) virus in humans has public health authorities around the world on high alert for the potential development of a human influenza pandemic. As of May 8, 2013, authorities had identified 131 confirmed cases and 32 deaths among residents of 8 provinces and 2 municipalities in China.


Three primary scenarios exist for how this A(H7N9) virus outbreak will unfold. First, the virus could disappear in the animal reservoir, ending new human cases. Second, the virus could persist in the animal reservoir, resulting in sporadic human infections. Third, the virus could, through mutation or reassortment, become readily transmissible between humans, resulting in a global pandemic.


(Continue . . .)


UPDATE: Just after I posted this blog, I discovered that Helen Branswell had published a long, and highly informative story that looks at this study, and Canada’s plans regarding vaccine testing.


Canada not planning H7N9 bird flu vaccine studies; will watch US results: PHAC

By: Helen Branswell, The Canadian Press


And for more on the challenges of vaccine effectiveness and production, you may wish to revisit this blog from last November:


CIDRAP: The Need For `Game Changing’ Flu Vaccines

image

Wednesday, January 02, 2013

JAMA: BMI And All Cause Mortality

image

Photo Credit CDC PHIL


# 6816


*** UPDATED ***

This study, which I knew would be controversial, has sparked serious rebukes from some members of the medical community. In the Interest of fairness, here is a link to an article from BBC News, where a number of doctors take issue with its findings.


'Weight is healthy' study criticised

A study which suggests being overweight can lead to a longer life has caused controversy among obesity experts.

(Continue . . . )

************************


As someone who has been `gravitationally challenged’ nearly all of his life, I naturally have concerns that my extra poundage may be cutting into my lifespan.


While aesthetically, thinner may be perceived by many as being better, increasingly we are seeing evidence to suggest that carrying a few extra pounds may actually extend one’s lifespan, not shorten it.


Last October, in Studies Weigh In On The `Obesity Paradox’, we looked at research that suggested that for people with certain medical conditions, including diabetes, congestive heart failure, kidney dialysis, heart attacks, and Asthma - carrying some extra weight appears to improve their outcomes


Now, in a study published in JAMA, we have the most comprehensive look to date at all-cause mortality spanning nearly 3 million people (and 270,000 deaths), and sorted by BMI (Body Mass Index) classification.


image

Photo Credit JAMA Report Video


The results, consistent across all ages and ethnic groups, indicated that while BMI’s over 35 (Class 2 and Class 3 obesity) increase overall mortality, that simply being overweight (BMI 25-<30) was associated with a significant reduction in all-cause mortality.


And even those who fell into the next higher BMI category (class 1 obesity) saw a 5% reduction in overall mortality compared to those falling into the normal weight BMI (18.5-<25).


Mortality rates do jump considerably once you reach a BMI > 35 ( resulting in a 29% increased risk of death for obesity grades 2 and 3). The HHS maintains an online BMI calculator HERE, where you can input your height and weight and quickly find out your number.


The JAMA article, which is heavy in statistics and details, is freely available at the following link.


Association of All-Cause Mortality With Overweight and Obesity Using Standard Body Mass Index Categories: A Systematic Review and Meta-analysis

Katherine M. Flegal, PhD; Brian K. Kit, MD; Heather Orpana, PhD; Barry I. Graubard, PhD

Conclusions and Relevance  Relative to normal weight, both obesity (all grades) and grades 2 and 3 obesity were associated with significantly higher all-cause mortality. Grade 1 obesity overall was not associated with higher mortality, and overweight was associated with significantly lower all-cause mortality. The use of predefined standard BMI groupings can facilitate between-study comparisons.


Several brief videos, and press release (excerpts below) can be viewed at:


Higher Levels of Obesity Associated With Increased Risk of Death; Being Overweight Associated With Lower Risk of Death

EMBARGOED FOR RELEASE: 3 P.M. (CT) TUESDAY, JANUARY 1, 2013

CHICAGO – In an analysis of nearly 100 studies that included approximately 3 million adults, relative to normal weight, overall obesity (combining all grades) and higher levels of obesity were both associated with a significantly higher all-cause risk of death, while overweight was associated with significantly lower all-cause mortality, according to a study in the January 2 issue of JAMA.


“Estimates of the relative mortality risks associated with normal weight, overweight, and obesity may help to inform decision making in the clinical setting,” according to background information in the article.


Katherine M. Flegal, Ph.D., of the National Center for Health Statistics, Centers for Disease Control and Prevention, Hyattsville, Md., and colleagues conducted a study to compile and summarize published analyses of body mass index (BMI) and all-cause mortality that provide hazard ratios (HRs) for standard BMI categories. For the review and meta-analysis, the researchers identified 97 studies that met inclusion criteria, which provided a combined sample size of more than 2.88 million individuals and more than 270,000 deaths. Regions of origin of participants included the United States or Canada (n = 41 studies), Europe (n = 37), Australia (n = 7), China or Taiwan (n = 4), Japan (n = 2), Brazil (n = 2), Israel (n = 2), India (n = l), and Mexico (n = l).


All-cause mortality HRs for overweight (BMI of 25-<30), obesity (BMI of ≥30), grade 1 obesity (BMI of 30-<35), and grades 2 and 3 obesity (BMI of ≥35) were calculated relative to normal weight (BMI of 18.5-<25).


The researchers found that the summary HRs indicated a 6 percent lower risk of death for overweight; a 18 percent higher risk of death for obesity (all grades); a 5 percent lower risk of death for grade 1 obesity; and a 29 percent increased risk of death for grades 2 and 3 obesity.


The authors note that the finding that grade 1 obesity was not associated with higher mortality suggests that that the excess mortality in obesity may predominantly be due to elevated mortality at higher BMI levels.

(Continue . . . )


In an accompanying editorial, Does Body Mass Index Adequately Convey a Patient’s Mortality Risk?, authors Steven B. Heymsfield, MD and William T. Cefalu, MD write:


The presence of a wasting disease, heart disease, diabetes, renal dialysis, or older age are all associated with an inverse relationship between BMI and mortality rate, an observation termed the obesity paradox or reverse epidemiology. The optimal BMI linked with lowest mortality in patients with chronic disease may be within the overweight and obesity range. Even in the absence of chronic disease, small excess amounts of adipose tissue may provide needed energy reserves during acute catabolic illnesses, have beneficial mechanical effects with some types of traumatic injuries, and convey other salutary effects that need to be investigated in light of the studies by Flegal et al and others.”


“Not all patients classified as being overweight or having grade 1 obesity, particularly those with chronic diseases, can be assumed to require weight loss treatment. Establishing BMI is only the first step toward a more comprehensive risk evaluation.”


While I can think of many other disadvantages to being overweight (my dreaded fear of wicker furniture being one), it appears that at least in terms of overall mortality - carrying a few extra pounds may actually turn out to be desirable - particularly among those who have chronic ailments.

Wednesday, November 28, 2012

JAMA: Waning Pertussis Vaccine Effectiveness Over Time

image
Credit CDC Pink Book


# 6744


Pertussis, or `whooping cough’ was once a major childhood disease in the United States, with more than a million cases reported between 1940 and 1945, resulting in thousands of deaths. 


All that began to change with the introduction of a whole cell Pertussis vaccine in the 1940s.  By 1960, the number of Pertussis cases in the United States had dropped to about 15,000 cases a year – a 95% reduction over 20 years.


Rates dropped another 2/3rds over the next 10 years (see chart above).


The vaccine, while highly effective, was blamed for a variety of adverse reactions, prompting a move away from whole cell pertussis vaccines to safer – but less broadly protective  - acellular vaccines in the 1990s


The following chart illustrates the rise in pertussis cases, which began in earnest in the early 1990s.  The most recent years (2010-2011) are not shown, but they were among the most active in decades.


image


While still far below the rates seen in the 1940s, the recent rise in Pertussis cases has raised a good deal of concern these past couple of years.  A few blogs on it include:


The UK’s Whooping Cough Outbreak
Referral: McKenna On Pertussis Vaccines
California Reports 9th Pertussis Fatality of 2010


The reasons behind these increases are complex, and not completely understood, but some factors may include:


  • lower vaccination uptakes
  • the move away from whole cell pertussis vaccines to safer acellular vaccines in the 1990s
  • evolutionary changes in the Bordetella pertussis bacteria.


Although infants are still at greatest risk from this illness, children aged 7 to 10 years old have experienced an unexpected rise in infections over the past decade.


A recent study published in the NEJM suggested that protection from the newer acellular pertussis vaccine – introduced in the early 1990s – may wane sooner than previously suspected. 


Waning Protection after Fifth Dose of Acellular Pertussis Vaccine in Children

Nicola P. Klein, M.D., Ph.D., Joan Bartlett, M.P.H., M.P.P., Ali Rowhani-Rahbar, M.D., M.P.H., Ph.D., Bruce Fireman, M.A., and Roger Baxter, M.D.

N Engl J Med 2012; 367:1012-1019 September 13, 2012DOI: 10.1056/NEJMoa1200850


Today we can add another study, this time appearing in JAMA, that finds that the protective effect of the Pertussis vaccine begins to wane after the fifth dose (normally given at age 5) is received, leaving 7 to 10 year olds at greater risk of infection.


Association of Childhood Pertussis With Receipt of 5 Doses of Pertussis Vaccine by Time Since Last Vaccine Dose, California, 2010

Lara K. Misegades, PhD, MS; Kathleen Winter, MPH; Kathleen Harriman, PhD, MPH, RN; John Talarico, DO, MPH; Nancy E. Messonnier, MD; Thomas A. Clark, MD, MPH; Stacey W. Martin, MSc


JAMA. 2012;308(20):2126-2132. doi:10.1001/jama.2012.14939

ABSTRACT (Excerpt)

Conclusion  Among children in 15 California counties, children with pertussis, compared with controls, had lower odds of having received the 5-dose DTaP series; as time since last DTaP dose increased, the odds increased, which is consistent with a progressive decrease in estimated vaccine effectiveness each year after the final dose of pertussis vaccine.


Pertussis remains a poorly controlled vaccine-preventable disease in the United States, despite a well-established childhood vaccination program and high coverage. Although infants have substantially higher rates of pertussis compared with other age groups, data from the National Notifiable Diseases Surveillance System reflect a recent increase in the number of reported pertussis cases among children aged 7 to 10 years. In 2010, this age group had the second highest incidence of pertussis in the United States.


The changing epidemiology raises important questions about possible waning protection from the childhood acellular pertussis vaccine series.

(Continue . . . )


This is a lengthy report, heavy on statistics.  For a less imposing summary, we have a nice write up today in Family Practice News:


Pertussis Vaccine Loses Efficacy Each Year After Fifth Dose


By: MARY ANN MOON, Family Practice News Digital Network

The odds of a child developing pertussis increase as the interval since he or she received the fifth and final dose of the DTaP vaccine increases, according to a report published in the November 28, 2012 issue of JAMA.


This pattern indicates a progressive waning of vaccine effectiveness every year after completion of the vaccine series, which would explain the recently noted surge in pertussis cases among 7- to 10-year-olds in at least 34 states, said Lara K. Misegades, Ph.D., of the Meningitis and Vaccine Preventable Disease Branch of the Centers for Disease Control and Prevention and her associates.

(Continue . . . )


As more confirmatory data comes in and is analyzed, the question then becomes what to do about this decline in protection for those aged 7 to 10 years of age.  The authors, in their conclusion, grant that their are no easy answers.


The increasing incidence of pertussis, changing epidemiology, and demonstrated decline in the estimated DTaP VE over time have raised concerns about the current US pertussis vaccine program and may prompt consideration of alternative schedules.


Options include delaying administration of the fifth DTaP dose or administering the Tdap booster at earlier than 11 years of age. However, a recommendation to delay the fifth DTaP dose until 6 years of age or later may unintentionally increase the burden of disease between the fourth and fifth doses of the childhood series, and implementation would likely be programmatically challenging because many states' school entry immunization requirements for pertussis are built around the current DTaP schedule.


Alternatively, shifting the Tdap booster to 10 years of age or earlier may have the unwanted effect of reducing coverage, as there is no established routine health care visit for children before the adolescent vaccine platform visit at 11 to 12 years of age.32


Given the options for adjustments to the pertussis vaccine schedule, these issues will require careful and ongoing review of the epidemiology and vaccine program nationwide. Ultimately, improved control of pertussis may require a vaccine that provides longer duration of protection or differently affects transmission in the community.

Sunday, November 11, 2012

UK: Norovirus Season Starts Early

image

80% of Norovirus Outbreaks occur between November & April - Credit CDC 


# 6710


Whether you call it Norwalk or Norovirus – the more descriptive `Winter Vomiting Bug’, or the less accurate `stomach flu’  - the virus behind millions of cases of gastroenteritis each year can pack more misery into 72 hours than should be allowed by law.


Long the scourge of crowded institutions - like nursing homes, cruise ships, hospitals and schools - the virus also circulates readily in the community, taking advantage of low levels of human immunity and its ease of spread.


After exposure and a short incubation period (12-24 hours), the victim usually experiences nausea, frequent vomiting & diarrhea, and stomach pain – and may also experience headache, fever, and body aches.


The illness generally runs its course in 1 to 3 (very long) days, and most people recover.


But among those who are aged or infirmed, the virus can take a heavy toll. According to the CDC, each year the norovirus:


  • causes about 21 million cases of acute gastroenteritis (inflammation of the stomach or intestines or both)
  • contributes to about 70,000 hospitalizations and 800 deaths, mostly among young children and the elderly


Last month in JAMA, a study of 407 norovirus outbreaks across 308 nursing homes showed an 11% increase in fatalities during times when a facility was experiencing an outbreak.


JAMA. 2012 Oct 24;308(16):1668-75.

Hospitalizations and mortality associated with norovirus outbreaks in nursing homes, 2009-2010.

Trivedi TK, DeSalvo T, Lee L, Palumbo A, Moll M, Curns A, Hall AJ, Patel M, Parashar UD, Lopman BA.


A short (2 minute) video on this paper may be viewed below. Among their recommendations, it is important to identify an outbreak early, take preventative measures, and nursing staff who become infected should not return to work until at least 48 hours after their symptoms have abated.


Already this winter, I’m aware of a couple of outbreaks here in Central Florida, and in the post-hurricane Sandy recovery, we’ve media reports that Viral outbreak at Hurricane Sandy evacuation shelter shuts 3 Brooklyn schools.


And from the UK today,  reports that their `winter vomiting bug season’ has gotten off to an early start.


Stomach flu earlier, worse in Britain

Published: Nov. 11, 2012 at 12:35 AM

LONDON, Nov. 11 (UPI) -- Norovirus, or the stomach flu, is 27 percent higher in Britain than at the same time last year and six weeks earlier than usual, health officials say.

(Continue . . .)


Earlier this week, the HPA posted the following notice on their Syndromic Surveillance site, indicating reports of vomiting were elevated, suggesting `community-based norovirus activity’.


image


One of the keys to prevention is good hand hygiene.


Unfortunately, unlike with many other bacteria and viruses, alcohol gel doesn’t do a particularly good job of killing the virus, as we discussed last year in  CMAJ: Hand Sanitizers May Be `Suboptimal’ For Preventing Norovirus.


Which makes a good old fashion hand scrubbing with soap and water the best preventative.


The primary method of infection is via the fecal-oral route. The CDC describes it this way:


Norovirus and Food

Norovirus is a leading cause of disease from contaminated foods in the United States. Foods that are most commonly involved in foodborne norovirus outbreaks include leafy greens (such as lettuce), fresh fruits, and shellfish (such as oysters). However, any food item that is served raw or handled after being cooked can become contaminated with noroviruses.

Norovirus Spreads Quickly

Norovirus can spread quickly from person to person in crowded, closed places like long-term care facilities, daycare centers, schools, hotels, and cruise ships. Noroviruses can also be a major cause of gastroenteritis in restaurants and catered-meal settings if contaminated food is served.


The viruses are found in the vomit and stool of infected people. You can get it by

  • Eating food or drinking liquids that are contaminated with norovirus (someone gets stool or vomit on their hands, then touches food or drink).
  • Touching surfaces or objects contaminated with norovirus and then putting your hand or fingers in your mouth.
  • Having direct contact with a person who is infected with norovirus (for example, when caring for someone with norovirus or sharing foods or eating utensils with them).

People with norovirus illness are contagious from the moment they begin feeling sick until at least 3 days after they recover. But, some people may be contagious for even longer.


The role of direct aerosolized human-to-human transmission of norovirus remains a bit murky, although there are numerous anecdotal reports that suggest that it happens.


The CDC – in a an MMWR report from 2011 called Updated Norovirus Outbreak Management and Disease Prevention Guidelines describes transmission thusly:


Transmission

Norovirus is extremely contagious, with an estimated infectious dose as low as 18 viral particles (41), suggesting that approximately 5 billion infectious doses might be contained in each gram of feces during peak shedding. Humans are the only known reservoir for human norovirus infections, and transmission occurs by three general routes: person-to-person, foodborne, and waterborne.


Person-to-person transmission might occur directly through the fecal-oral route, by ingestion of aerosolized vomitus, or by indirect exposure via fomites or contaminated environmental surfaces.


The CDC recommends the following steps to protect yourself from the virus.


image


Good advice, but frankly - having already gone through at least one memorable bout with the virus - if I found myself caring for someone with Norovirus in my household, I’d take a few extra precautionary steps.


According to:


GUIDELINE FOR THE PREVENTION AND CONTROL OF NOROVIRUS GASTROENTERITIS OUTBREAKS IN HEALTHCARE SETTINGS

Taranisia MacCannell, PhD, MSc ; Craig A. Umscheid, MD, MSCE ; Rajender K. Agarwal, MD, MPH ; Ingi Lee, MD, MSCE ; Gretchen Kuntz, MSW, MSLIS ;Kurt B. Stevenson, MD, MPH 3 and the Healthcare Infection Control Practices Advisory Committee (HICPAC)

(EXCERPT)

PERSONAL PROTECTIVE EQUIPMENT

23. If norovirus infection is suspected, adherence to PPE use according to Contact and Standard Precautions is recommended for individuals entering the patient care area (i.e., gowns and gloves upon entry) to reduce the likelihood of exposure to infectious vomitus or fecal material.    (Category IB) (Key Question 1.C.4)

  
24. Use a surgical or procedure mask and eye protection or a full face shield if there is an anticipated risk of splashes to the face during the care of patients, particularly among those who are vomiting. (Category IB) (Key Question 3.C.2.a) 


25. More research is needed to evaluate the utility of implementing Universal Gloving (e.g., routine use of gloves for all patient care) during norovirus outbreaks. (No recommendation/unresolved issue) 


One of the reasons I keep a generous supply of exam gloves, and surgical (& N95) masks in my emergency kit. 


And finally, earlier this year in Norovirus Sequelae we looked at  a new study appearing in Clinical Infectious Diseases that found a link between norovirus infection and ongoing gastrointestinal complaints.


Researchers looked at the records of more than 1700 military personnel who were treated for AGE (acute gastroenteritis) during three known norovirus outbreaks.


By comparing them to controls, they determined that those with a history of AGE were at increased risk of developing chronic gastrointestinal disorders.


Since this was a fairly small study, and some variability was detected in outcomes across the three outbreaks studied, more research will be needed to confirm their findings and to determine how long these after effects may persist.


Still, this is one virus that you want to avoid catching, if at all possible.

Wednesday, February 23, 2011

JAMA: Cell Phone Use Stimulates Brain Activity


# 5334


Concerns over the potential health ramifications of long-term & frequent cell phone use continues despite a number of studies that have yielded inconsistent results.


In May of 2010, the International Agency for Research on Cancer (IARC) released their long-delayed INTERPHONE report, which was unable to establish a link between cell phone use and brain tumors  (see The IARC Cell Phone Report)


Of course, it can sometimes take years – or even decades – of research before the full effect of a new technology like cellular communications can be adequately established.


Today we’ve a new study that looks at how cell phone radiation affects brain activity, which is published in the February 23rd issue of JAMA.


The short version is: Prolonged exposure to cell phone radiation has now been shown to increase brain activity, but the clinical significance (if any) of such increases are unknown.


First a link and some excerpts from the abstract, followed by links to a video, press release, after which I will return.


Effects of Cell Phone Radiofrequency Signal Exposure on Brain Glucose Metabolism

Nora D. Volkow, MD; Dardo Tomasi, PhD; Gene-Jack Wang, MD; Paul Vaska, PhD; Joanna S. Fowler, PhD; Frank Telang, MD; Dave Alexoff, BSE; Jean Logan, PhD; Christopher Wong, MS

(EXCERPTS)

Objective To evaluate if acute cell phone exposure affects brain glucose metabolism, a marker of brain activity

Conclusions In healthy participants and compared with no exposure, 50-minute cell phone exposure was associated with increased brain glucose metabolism in the region closest to the antenna. This finding is of unknown clinical significance.

The link to the press release, embargoed until yesterday afternoon, follows:


Cell Phone Use May Have Effect on Brain Activity, But Health Consequences Unknown

FOR RELEASE: 3 P.M. (CT) TUESDAY, FEBRUARY 22, 2011


Media Advisory: To contact Nora D. Volkow, M.D., call the NIH press office at 301-496-5787 or email

nmb@od.nih.gov.

To contact editorial co-author Lennart Hardell, M.D., Ph.D., email lennart.hardell@orebroll.se.

Cell Phone Use May Have Effect on Brain Activity, But Health Consequences Unknown

CHICAGO – In a preliminary study, researchers found that 50-minute cell phone use was associated with increased brain glucose metabolism (a marker of brain activity) in the region closest to the phone antenna, but the finding is of unknown clinical significance, according to a study in the February 23 issue of JAMA.


“The dramatic worldwide increase in use of cellular telephones has prompted concerns regarding potential harmful effects of exposure to radiofrequency-modulated electromagnetic fields (RF-EMFs). Of particular concern has been the potential carcinogenic effects from the RF-EMF emissions of cell phones. However, epidemiologic studies of the association between cell phone use and prevalence of brain tumors have been inconsistent (some, but not all, studies showed increased risk), and the issue remains unresolved,” according to background information in the article. The authors add that studies performed in humans to investigate the effects of RF-EMF exposures from cell phones have yielded variable results, highlighting the need for studies to document whether RF-EMFs from cell phone use affects brain function in humans.

image

(Continue . . . )


This study basically used PET scans (Positron emission tomography) to chart the brain’s activity via it’s uptake of F-FDG, a radioactive pharmaceutical used for imaging the heart, lungs, and brain.


Participants underwent PET Scans with cell phones placed on their left and right ears; once with the right cell phone `on’ (with sound muted) for 50 minutes and once with both cell phones `off’.


Areas of the brain in close proximity to the antennas of the activated cell phones demonstrated increased glucose uptake, indicating increased localized brain activity in response to the RF (radio frequency) emissions.


This study indicates that the prolonged use of a cell phone does affect brain activity. What all this might mean in regards to human health is unknown for now.


In an accompanying editorial, Cell Phone Radiofrequency Radiation Exposure and Brain Glucose Metabolism, Henry Lai, PhD & Lennart Hardell, MD, PhD write:


“Although the biological significance, if any, of increased glucose metabolism from acute cell phone exposure is unknown, the results warrant further investigation. An important question is whether glucose metabolism in the brain would be chronically increased from regular use of a wireless phone with higher radiofrequency energy than those used in the current study. Potential acute and chronic health effects need to be clarified. Much has to be done to further investigate and understand these effects.”


These authors also question whether the changes to brain function detected in this study could adversely affect other physiological functions of the body.


Admittedly, not many answers from this study. 


But it raises a lot of questions.

Wednesday, December 01, 2010

JAMA: Inconsistent Dosing Instructions For OTC Meds


# 5104


Imagine you purchase a bottle of liquid medicine and the instructions on the box tell you to take 2 tablespoons (30mL) every 4 hours and give your 6 year-old child 1 tablespoon (15mL) every four hours.  


The handy measuring device provided by the manufacturer looks like this:


image

Figure 2 from the JAMA study

Nowhere on this measuring cup are there Tablespoon markings. . .  only teaspoons, and mL


And the largest measurement – 4tsp - isn’t even a recommended dose.  It is too much for a child, and not enough for an adult.


Of course, you may consider yourself lucky. Some medicines don’t even provide a measuring device. 


Welcome to the confusing world of inconsistent OTC (Over-the-Counter) drug dosing instructions.


And while you might consider yourself capable of doing the mental conversion gymnastics in your head, not everyone is equally medically astute.


Besides . . any bleary-eyed, stressed out, and sleep deprived parent ladling out medicine to a sick child in the middle of the night can be subject  to confusion - particularly when the instructions are less than perfectly clear.


In the fall of 2009, the FDA and the Consumer Health Products Association (CHPA) each released similar new voluntary guidelines for the packaging and dosing instructions of liquid medications, particularly those intended for use by children.


The FDA’s recommendations were pretty simple, with the main ones being:


  • Measuring devices should be included for all over-the-counter liquid medications.
  • Devices should be marked with calibrated units of measure that are the same as those specified in the labeled dosage directions.
  • Abbreviations used on devices should be the same as those used in directions.
  • Devices should not bear extraneous or unnecessary markings.
  • Devices should not be significantly larger than the largest dose described.
  • Abbreviations should conform to international or national standards.
  • Abbreviations should be defined on devices and/or label directions.
  • Decimals and fractions should be used with care and conform to recommendations


While most of these recommendations may seem fairly obvious, apparently they weren’t to the manufacturers.


According to this study, nearly all (well, 98.6%) of oral OTC medications examined prior to these guidelines being released contained dosing directions and measuring devices that were `highly variable or inconsistent’.


Ambiguities and inconsistencies that could easily lead to the under-dosing or over-dosing of a child with the medication.


JAMA has two free articles available on the subject.


A study study that takes an eye-opening look at the poorly conceived OTC dosing instructions on 200 popular pediatric oral liquid medications surveyed in 2009, and an editorial on the study.


First, a look at the study.  I’ve only posted a snippet from the abstract.  You’ll want to read the whole thing.


Evaluation of Consistency in Dosing Directions and Measuring Devices for Pediatric Nonprescription Liquid Medications

H. Shonna Yin, MD, MS; Michael S. Wolf, PhD, MPH, MA; Benard P. Dreyer, MD; Lee M. Sanders, MD, MPH; Ruth M. Parker, MD

JAMA. Published online November 30, 2010. doi:10.1001/jama.2010.1797

Abstract (Excerpts reformatted)

Results Measuring devices were packaged with 148 of 200 products (74.0%).


Within this subset of 148 products, inconsistencies between the medication's dosing directions and markings on the device were found in 146 cases (98.6%).


These included missing markings (n = 36, 24.3%) and superfluous markings (n = 120, 81.1%).


Across all products, 11 (5.5%) used atypical units of measurement (eg, drams, cc) for doses listed.


Milliliter, teaspoon, and tablespoon units were used for doses in 143 (71.5%), 155 (77.5%), and 37 (18.5%) products, respectively.


A nonstandard abbreviation for milliliter (not mL) was used by 97 products. Of the products that included an abbreviation, 163 did not define at least 1 abbreviation.


Conclusion At the time the FDA released its new guidance, top-selling pediatric OTC liquid medications contained highly variable and inconsistent dosing directions and measuring devices.


You’ll also want to read the accompanying editorial.


Ensuring Safe and Effective Use of Medication and Health Care

Perfecting the Dismount

Darren A. DeWalt, MD, MPH


CHPA, which is a trade association representing U.S. manufacturers and distributors of over-the-counter medicines and nutritional supplements, released a statement yesterday in response to the publication of these two articles in JAMA.


You can read it at the link below.

CHPA Statement Outlining Measuring and Dosing Improvements Already Made for Liquid OTC Medicines for Children


For now, the guidelines issued by CHPA and the FDA are strictly voluntary.


It will likely require another study some time in the future to determine how much progress has been made in the adoption of these recommendations.

Tuesday, April 20, 2010

Study: Antivirals Saved Lives Of Pregnant Women


UPDATED


# 4511


A study today, published in JAMA, points out the increased burden that pandemic H1N1 placed on pregnant women, and the apparent efficacy of early antiviral treatment in reducing mortality.


Mike Stobbe of the Associated Press has an overview, which is followed by the JAMA abstract, and a few comments of my own.


Study: Fast Tamiflu treatment saved many pregnant swine flu victims in US

MIKE STOBBE AP Medical Writer

ATLANTA (AP) — Quick treatment with flu medicine saved the lives of many pregnant women who were stricken by swine flu last year, according to the most complete analysis of deaths among expectant mothers.


The study by the Centers for Disease Control and Prevention counted 56 pregnant women who died from the new virus in 2009, confirming the dangers of the disease to this group.


Based primarily on U.S. figures from the first few months of the global epidemic, which began last April, CDC officials believe that though pregnant women account for just 1 percent of the population, they have at times accounted for as many as 5 percent of swine flu deaths.

(Continue. . . )


Excerpts from the JAMA Abstract follow:


Pandemic 2009 Influenza A(H1N1) Virus Illness Among Pregnant Women in the United States


Alicia M. Siston, PhD; Sonja A. Rasmussen, MD; Margaret A. Honein, PhD; Alicia M. Fry, MD; Katherine Seib, BS; William M. Callaghan, MD; Janice Louie, MD; Timothy J. Doyle, MPH; Molly Crockett, MPH; Ruth Lynfield, MD; Zack Moore, MD; Caleb Wiedeman, MPH; Madhu Anand, MPH; Laura Tabony, MPH; Carrie F. Nielsen, PhD; Kirsten Waller, MD; Shannon Page, BS; Jeannie M. Thompson, MPH; Catherine Avery, CFNP; Chasisity Brown Springs, MSPH; Timothy Jones, MD; Jennifer L. Williams, MSN; Kim Newsome, MPH; Lyn Finelli, DrPH; Denise J. Jamieson, MD; for the Pandemic H1N1 Influenza in Pregnancy Working Group

JAMA. 2010;303(15):1517-1525.

Context Early data on pandemic 2009 influenza A(H1N1) suggest pregnant women are at increased risk of hospitalization and death.


Objective To describe the severity of 2009 influenza A(H1N1) illness and the association with early antiviral treatment among pregnant women in the United States.


<SNIP>


Conclusions Pregnant women had a disproportionately high risk of mortality due to 2009 influenza A(H1N1). Among pregnant women with 2009 influenza A(H1N1) influenza reported to the CDC, early antiviral treatment appeared to be associated with fewer admissions to an ICU and fewer deaths.


You see a good deal of skepticism expressed online, and sometimes in the mainstream media, about the effectiveness and appropriateness of antiviral therapy for influenza.


Critics point out that the drug can have (rare) side effects and that it only reduces the duration of seasonal flu symptoms by an average of 1.3 days.    A modest but measureable benefit.


Where Tamiflu – and other antivirals – appear to make a bigger difference is in reducing symptoms in those who have pre-existing risk factors or conditions – including pregnancy – or those who are experiencing influenza complications.


And among H5N1 bird flu cases around the world, those that have survived (40%) were likely to have received early antiviral intervention.


Granted, most of the `evidence’ for the effectiveness of antivirals comes from observational studies, which some researchers find wanting (see BMJ: A Review Of Tamiflu’s Efficacy Against Seasonal Influenza).


Randomized controlled trials (RCTs) – while considered the `gold standard’ for drug research – are nearly impossible to conduct ethically since you’d have to withhold potentially life saving treatment from randomly selected test subjects. 


We would all like medicine to be based on treatments and drugs proved beyond a shadow of a doubt – to be safe and effective . . . but sometimes we must accept a lower burden of proof -the preponderance of evidence - instead.  


And right now, the evidence continues to point to antivirals as being a valuable tool in the treatment of severe influenza.


UPDATE:


Lisa Schnirring of CIDRAP News has a very nice overview of this story entitled:


Early antivirals mean fewer ICU visits for pregnant pandemic flu patients

Lisa Schnirring * Staff Writer

Apr 20, 2010 (CIDRAP News) – In the biggest and most detailed look yet at pandemic flu infections in pregnant women, researchers from the US Centers for Disease Control and Prevention (CDC) reported today that early antiviral treatment was linked to fewer intensive care unit (ICU) admissions and that severe illnesses and deaths are more likely to occur during the third trimester.

The CDC researchers, along with a Pandemic H1N1 Influenza in Pregnancy Working Group made up of health officials from several states, based their findings on reports of pregnant women who were sick with pandemic H1N1 infections through August plus more recent reports of women who were admitted to ICUs. The findings appear in the Apr 21 issue of the Journal of the American Medical Association (JAMA).

(Continue . . . )

Tuesday, November 03, 2009

Study: H1N1 A Threat To All Age Groups


# 3945


While it is true that 90% of the H1N1 infections have been among those under 65, when those over that age get this virus, it can provoke a very serious illness. 


That’s one of the messages from a study, published today in JAMA, entitled Factors Associated With Death or Hospitalization Due to Pandemic 2009 Influenza A(H1N1) Infection in California


Reuters summarizes the study below, and you’ll find excerpts from the abstract below that.


Swine flu not just a threat to young: study

Tue Nov 3, 2009 5:22pm EST

By Julie Steenhuysen

CHICAGO (Reuters) - Swine flu can cause severe disease in people of all ages and appears to pose a special threat to those who are obese, according to an analysis of H1N1 cases in California released on Tuesday.


Public health researchers analyzed the state's first 1,088 hospitalized and fatal cases of H1N1 infection between April 23 and August 1.


Like other studies, they found the average patient who was hospitalized with H1N1 flu was younger than what is commonly seen with seasonal flu, but they also found severe disease at both ends of the age spectrum.


"What our study shows was that once you were hospitalized, if you were elderly you have a higher risk of dying," Dr. Janice Louie of the California Department of Public Health in Richmond, whose study appears in the Journal of the American Medical Association.


Dr. Thomas Frieden, director of the U.S. Centers for Disease Control and Prevention, said the study matches the CDC's own observations -- that H1N1 affects all age groups, including people over 65.


(Continue. . . )


Factors Associated With Death or Hospitalization Due to Pandemic 2009 Influenza A(H1N1) Infection in California

Janice K. Louie, MD, MPH; Meileen Acosta, MPH; Kathleen Winter, MPH; Cynthia Jean, MPH; Shilpa Gavali, MPH; Robert Schechter, MD, MPH; Duc Vugia, MD; Kathleen Harriman, PhD; Bela Matyas, MD; Carol A. Glaser, MD, DVM; Michael C. Samuel, DrPH; Jon Rosenberg, MD; John Talarico, DO, MPH; Douglas Hatch, MD; for the California Pandemic (H1N1) Working Group

JAMA. 2009;302(17):1896-1902.


Results During the study period there were 1088 cases of hospitalization or death due to pandemic 2009 influenza A(H1N1) infection reported in California. The median age was 27 years (range, <1-92 years) and 68% (741/1088) had risk factors for seasonal influenza complications.


Sixty-six percent (547/833) of those with chest radiographs performed had infiltrates and 31% (340/1088) required intensive care. Rapid antigen tests were falsely negative in 34% (208/618) of cases evaluated.


Secondary bacterial infection was identified in 4% (46/1088). Twenty-one percent (183/884) received no antiviral treatment. Overall fatality was 11% (118/1088) and was highest (18%-20%) in persons aged 50 years or older. The most common causes of death were viral pneumonia and acute respiratory distress syndrome.


Conclusions In the first 16 weeks of the current pandemic, the median age of hospitalized infected cases was younger than is common with seasonal influenza. Infants had the highest hospitalization rates and persons aged 50 years or older had the highest mortality rates once hospitalized. Most cases had established risk factors for complications of seasonal influenza.

Monday, October 12, 2009

The View From The ICU


# 3828


While the H1N1 virus has proved to be a moderate illness for the vast majority of those infected, for a small percentage of mostly younger patients, infection has proved life-threatening. 


Betsy McKay of the Wall Street Journal has report today on the severity of illness being seen in ICUs around the world, and how that raises concerns on what we may see this fall and winter in the northern hemisphere.


  • OCTOBER 12, 2009, 10:45 A.M. ET

Swine Flu Is Severe for Some, Studies Show

by BETSY MCKAY

Swine flu may be mild for most people, but some become so gravely ill that they require sophisticated techniques, equipment, and aggressive treatment in intensive-care units to survive, according to three new studies.


"This is the most severely ill that we've ever seen people," said Anand Kumar, lead author of one of the studies and ICU attending physician for the Winnipeg Regional Health Authority in Canada.


"There's almost two diseases. Patients are either mildly ill or critically ill and require aggressive ICU care. There isn't that much of a middle ground."


(Continue . . .)


JAMA  (The Journal of The American Medical Association) has a series of 4 articles published today on the impact of H1N1 on ICUs from around Canada, Mexico, and Australia & New Zealand.


These are freely available without subscription.


  • Critically Ill Patients With 2009 Influenza A(H1N1) Infection in Canada Published October 12, 2009.
  •  

  • Critically Ill Patients With 2009 Influenza A(H1N1) in Mexico Published October 12, 2009.
  •  

  • Extracorporeal Membrane Oxygenation for 2009 Influenza A(H1N1) Acute Respiratory Distress Syndrome Published October 12, 2009.
  •  

  • Preparing for the Sickest Patients With 2009 Influenza A(H1N1) Published October 12, 2009.
  •  

    The first two studies outline the experiences of ICUs in Canada and Mexico. 


    The 3rd study, on ECMO use in Australia & New Zealand, indicates that the average length of time severely ill patients required this heart-lung bypass was a remarkable 10 days.  Despite this intervention, patients placed on ECMO saw a 21% mortality rate.


    For more information on ECMO, you may wish to revisit my blog The ECMO Option.


    The last article is basically a summation of some of the information from the first 3 studies.  


    All four are worth your time to review.

    Thursday, October 01, 2009

    JAMA: Surgical Masks vs N95 Respirators


    # 3791


    Just two weeks after Raina MacIntyre, head of public health at the University of New South Wales in Sydney, presented evidence at the ICAAC conference on the lack of protection offered by surgical facemasks (see A Surgical Mask Strike) we get another study, that this time seems to support the notion that surgical masks may offer protection against influenza infection.


    Given the reported shortage of N95 masks and reluctance of some health care workers to wear them for long periods of time, many health care facilities would like to move to the less expensive and easier to obtain surgical mask for staff not performing aerosol generating procedures on influenza patients.


    Yesterday the NEJM published a perspective article (see NEJM Perspective: Respiratory Protection For HCWs) based on the recent IOM evaluation of surgical masks vs. respirators, and reiterated the advice:


    Until more data are available, the committee recommends that clinicians reach for the N95 respirator when confronting patients with influenza-like illnesses, particularly in enclosed spaces.


    Today JAMA (Journal of the American Medical Association) published a study which reports that HCWs using surgical masks experienced `noninferior rates of laboratory-confirmed influenza’.


    The major implication here, according to the authors, is that surgical masks provide similar protection to N95 respirators in a routine health care setting.  

    The authors acknowledge certain limitations to their study, including an inability to determine whether those participants who became infected contracted influenza in the workplace, at home, or in the greater community. They believe that such exposures were balanced between both groups, however.


    Obviously we are some distance away from reaching a consensus on this issue.   


    Here is a link, and excerpts, from the study’s abstract.


    Surgical Mask vs N95 Respirator for Preventing Influenza Among Health Care Workers

    A Randomized Trial

    Mark Loeb, MD, MSc; Nancy Dafoe, RN; James Mahony, PhD; Michael John, MD; Alicia Sarabia, MD; Verne Glavin, MD; Richard Webby, PhD; Marek Smieja, MD; David J. D. Earn, PhD; Sylvia Chong, BSc; Ashley Webb, BS; Stephen D. Walter, PhD

    JAMA. 2009;302(17):(doi:10.1001/jama.2009.1466).


    Results Between September 23, 2008, and December 8, 2008, 478 nurses were assessed for eligibility and 446 nurses were enrolled and randomly assigned the intervention; 225 were allocated to receive surgical masks and 221 to N95 respirators.
    Influenza infection occurred in 50 nurses (23.6%) in the surgical mask group and in 48 (22.9%) in the N95 respirator group (absolute risk difference, –0.73%; 95% CI, –8.8% to 7.3%; P = .86), the lower confidence limit being inside the noninferiority limit of –9%.


    Conclusion Among nurses in Ontario tertiary care hospitals, use of a surgical mask compared with an N95 respirator resulted in noninferior rates of laboratory-confirmed influenza.


    The link to the entire article is:

    Surgical Mask vs N95 Respirator for Preventing Influenza Among Health Care Workers Published October 1, 2009.


    A hat tip to Ironorehopper on Flutrackers for posting this link.