Showing posts with label Weekly. Show all posts

Monday, February 21, 2011

ECDC: European Flu Surveillance Week 6


# 5328


While many European nations continue to report medium to high levels of influenza-like (ILI) activity, the latest surveillance shows more than a dozen countries with ILI numbers on the decline. 


image

Surveillance in some central and south-eastern European nations is somewhat limited, so the influenza trends in those regions are less certain.  Still, this latest report suggests that for much of Europe, their Influenza A season has peaked.


During the 2011-2012 flu season the  2009 H1N1 virus has continued to predominate, but a number of countries are now seeing a shift to primarily influenza B (including the UK, Norway, Belgium, Spain, and Sweden).


image


While concerns exist over the 28 resistant H1N1 viruses detected this season, the former pandemic virus continues to be overwhelmingly sensitive to oseltamivir (96.2%) and zanamivir (100%) (among the 738 samples tested). 


image


The full ECDC weekly report may be accessed at the link below.


Main surveillance developments in week

 
6/2011 (07 Feb 2011 – 13 Feb 2011)

•  Most European countries continue to report medium to high influenza-like illness/acute respiratory infection consultation rates and widespread activity. Decreasing ILI/ARI trends were reported by 14 countries.

• The proportion of influenza virus-positive sentinel specimens has gradually decreased to 43% after     peaking in week 52/2010 at 57%

•  Sixty-seven per cent of influenza virus detections in week 6/2011 were type A, 33% were type B. More than 99% of subtyped influenza A viruses were A(H1N1)2009.

•  In week 6/2011, ten countries reported 180 all-cause SARI and hospitalised confirmed influenza cases, the latter mostly due to influenza virus A(H1N1)2009 infection.

•  Numbers of influenza infections with severe outcome have decreased in western European Union countries (Denmark, France, the Netherlands, Ireland, Spain and the UK). However, there is considerable uncertainty about severe cases in a number of countries, especially those in central, eastern and south-eastern European countries, because of limited hospital surveillance.

(Continue . . . )

Monday, February 14, 2011

EuroFlu Surveillance Week 5


# 5312


Even though levels of ILIs (Influenza-like Illnesses) have dropped well below the baseline level in the UK (see HPA Weekly Influenza Surveillance), influenza activity continues strong across the rest of Europe.


In week 5, once again the 2009 H1N1 virus remains the dominant player, although in some countries influenza B levels are equal to, or even exceed that of the old pandemic strain.  


Unlike here in the United States, seasonal H3N2 continues to circulate across Europe in only low levels.


While trends and averages can be established, across the 48 reporting nations covered by the EuroFlu weekly report, there still remains a good deal of variance in activity and virus dominance between nations and regions.


Note: In Europe the acronym SARI is used to denote Severe Acute Respiratory Infection.


Some excerpts (reformatted for readability) from this week’s report:


image

EuroFlu - Weekly Electronic Bulletin
Week 5 : 31/01/2011-06/02/2011
11 February 2011, Issue N° 388

Continued high influenza activity in the WHO European Region

  • This issue is based on data reported in week 5/2011 by 48 Member States in the WHO European Region.
  • Clinical consultation rates for influenza-like illness (ILI) and/or acute respiratory infections (ARI) are increasing in 27 countries, while 9 others have passed peaks in clinical activity.
  • 46% of sentinel specimens from patients with ILI and/or ARI, and 54% of specimens from sentinel SARI patients were positive for influenza in week 5/2011.
  • 98% of antigenically characterized viruses from the 2010/2011 influenza season are similar to the viruses included in the 2010/2011 northern hemisphere influenza vaccines.

Current situation – week 5/2011

During week 5/2011, 2 countries (Georgia and Luxembourg) and 3 regions of the Russian Federation reported very high intensity of influenza activity; 6 countries reported high intensity and 25 reported medium intensity. 21 countries reported widespread activity. Of the 25 countries reporting on the impact of influenza on health care systems, 1 (Georgia) reported severe impact; 11 countries reported moderate impact and 13, low impact.


Clinical data also indicated increasing influenza activity in much of the WHO European Region, as 27 countries reported increasing trends in consultation rates for ILI and/or ARI. Some countries in the central, south-eastern and eastern parts of the Region have reported pronounced increases in clinical ILI or ARI activity. In general, the highest consultation rates were reported for children aged 5–14 and 0–4 years.


<SNIP>


Virological situation – week 5/2011

Pandemic influenza A(H1N1) 2009 was reported to be dominant in 17 countries and co-dominant with influenza B in 12 countries.


Influenza B was dominant in 5 countries. During the past few weeks, the predominance of influenza B viruses has increased in countries in western Europe, which had predominantly pandemic A(H1N1) viruses circulating at the start of their season.


In a number of eastern European countries, the earlier predominance of influenza B viruses has now shifted to a predominance of pandemic influenza A(H1N1) 2009 viruses.


Comment


ILI and ARI consultation rates continue to increase in the WHO European Region, particularly in the central, eastern and south-eastern parts, and the percentage of sentinel specimens positive for influenza remains high.


Influenza activity is progressing in a west-to-east manner across the Region, with pandemic influenza A(H1N1) 2009 circulation generally decreasing in the western part of the Region and increasing in the eastern.


Influenza B is becoming relatively more predominant in countries where the prevalence of pandemic influenza A (H1N1) 2009 is decreasing. This shift, with relatively more A(H1N1) 2009 viruses circulating in the eastern part of the Region, may explain the notable difference in the proportion of influenza A to influenza B viruses among SARI patients in week 5/2011, when compared to all SARI viruses for the cumulative 2010/2011 influenza season.


This is because most of the countries conducting sentinel SARI surveillance are in the central and eastern part of the WHO European Region. 98% of antigenically characterized viruses from the 2010/2011 influenza season are similar to the viruses recommended for inclusion in the 2010/2011 northern hemisphere influenza vaccines.

(Continue . . . )


Saturday, February 12, 2011

ECDC: European Flu Surveillance Week 5


# 5308


The end-of-week flu surveillance reports continue to come in, with the ECDC’s week 5 summary showing that medium to high levels of influenza continue in a number of European countries.


As depicted in the graph below,the 2009 H1N1 virus continues to lead the pack in Europe by a wide margin, in stark contrast to North America where H3N2 has comprised the bulk of this year’s flu samples.


image


A few highlights from this week’s report:


11 February 2011

Main surveillance developments in week 5/2011 (31 Jan – 06 Feb 2011)


  • Most European countries continue to report medium to high influenza-like illness/acute respiratory infection consultation rates and widespread activity. Increasing trends are mainly observed in central, eastern and southern Europe whereas countries in western and northern Europe are  reporting unchanging or declining trends.
  • The proportion of influenza-positive sentinel specimens is gradually decreasing, having now reached 46%.
  • 67% of influenza virus detections in week 5/2011 were type A, 33% were type B. In nine countries, type B detections exceeded those of type A. More than 98% of subtyped influenza A viruses were A(H1N1)2009.
  • In week 5/2011, ten countries reported 194 all-cause SARI and confirmed hospitalised influenza cases, the latter mostly due to influenza A(H1N1)2009.
  • Numbers of influenza infections with severe outcome have declined in western European countries (Denmark, France, the Netherlands, Ireland and the UK). However, there is now considerable uncertainty on information concerning severe cases in central and eastern European countries.


image


Virological surveillance

(excerpt)

Since week 40/2010, Ireland, Italy, Norway, Spain and the UK have reported antiviral resistance data to TESSy (Table 3). Twenty-three (3.2%) of 720 influenza A(H1)2009 viruses tested for susceptibility to neuraminidase inhibitors were resistant to oseltamivir, but remained sensitive to zanamivir. All the resistant viruses carried the H275Y substitution.


Nineteen resistant viruses were from patients with known exposure to antivirals. While for seven of these patients, no exposure to neuraminidase inhibitors was reported, 12 had been exposed to oseltamivir.

Saturday, January 29, 2011

North America: Flu Surveillance Week 3


# 5266


The weekly surveillance numbers from Canada and the United States were released yesterday and some interesting trends are beginning to emerge.


In Canada, the peak of the flu season may have been reached, although some indicators are up while others are down – while in the United States influenza activity is picking up pretty much across the board.


Interestingly, while the H3N2 virus remains the dominant influenza A strain detected in the United States, after several months of low activity, levels of H1N1 have risen 3 weeks in a row.


We’ll start with Canada’s weekly FluWatch report.


January 16 to January 22, 2011 (Week 03)

Summary of FluWatch Findings for the Week ending January 22, 2011

  • Overall influenza detections appear to have peaked, with most regions across the country now showing a decline in the percentage of positive influenza detections, except BC and the Atlantic provinces. Paediatric and adult hospitalizations have decreased this week, however, some indicators have increased including the number of regions reporting widespread and localized influenza/ILI activity, the number of outbreaks, and the ILI consultation rate.  
  • Since the beginning of the season, 89.5% of the subtyped positive influenza A specimens were influenza A/H3N2.In week 03, detections of pandemic H1N1 2009 increased slightly to 16.9% of all subtyped influenza A specimens, compared to 15.5% in week 02. The overall proportion of positive tests for RSV has increased from 9.6% to 12.5% in week 03.

image

image

Percent positive influenza tests, compared to other respiratory viruses, Canada, by reporting week, 2010-2011

Percent positive influenza tests, compared to other respiratory viruses, Canada, 
by reporting week, 2010-2011


Moving south, the CDC’s  FluView system paints a picture of a flu season still gaining speed.  While it varies from year-to-year, February is usually the the height of the influenza season in the United States.


2010-2011 Influenza Season Week 3 ending January 22, 2011

All data are preliminary and may change as more reports are received.

Synopsis:

During week 3 (January 16-22, 2011), influenza activity in the United States increased.

  • Of the 5,823 specimens tested by U.S. World Health Organization (WHO) and National Respiratory and Enteric Virus Surveillance System (NREVSS) collaborating laboratories and reported to CDC/Influenza Division, 1,754 (30.1%) were positive for influenza.
  • The proportion of deaths attributed to pneumonia and influenza (P&I) was below the epidemic threshold.
  • Three influenza-associated pediatric deaths were reported. Two of these deaths were associated with influenza A (H3) virus infection and one was associated with an influenza B virus.
  • The proportion of outpatient visits for influenza-like illness (ILI) was 3.6%, which is above the national baseline of 2.5%. Six of the 10 regions (Regions 2, 3, 4, 5, 6, and 7) reported ILI above region-specific baseline levels. Nine states experienced high ILI activity, eight states experienced moderate ILI activity, New York City and nine states experienced low ILI activity, 24 states experienced minimal ILI activity, and data were insufficient from the District of Columbia.
  • The geographic spread of influenza in 25 states was reported as widespread; 16 states reported regional influenza activity; the District of Columbia and four states reported local influenza activity, Puerto Rico, the U.S. Virgin Islands, and four states reported sporadic influenza activity, Guam reported no influenza activity, and one state did not report.

U.S. Virologic Surveillance:

WHO and NREVSS collaborating laboratories located in all 50 states and Washington D.C. report to CDC the number of respiratory specimens tested for influenza and the number positive by influenza type and subtype. The results of tests performed during the current week are summarized in the table below.

All 50 states and the District of Columbia have reported laboratory-confirmed influenza this season.

image

INFLUENZA Virus Isolated

Pneumonia and Influenza (P&I) Mortality Surveillance

During week 3, 7.5% of all deaths reported through the 122-Cities Mortality Reporting System were due to P&I. This percentage was below the epidemic threshold of 7.9% for week 3.

Pneumonia And Influenza Mortality

image

(click for interactive map)


For more on all of this, Lisa Schnirring at CIDRAP news has an excellent summary of this week’s flu reports.


US flu picking up pace; global activity mixed

Thursday, January 13, 2011

UK: HPA Influenza Report – Week 2


# 5229


While some of the media reports of the past week or so would have the casual observer believing that the UK’s flu outbreak continues to escalate, the numbers reported in the latest weekly report suggest that the situation may be stabilizing.


These latest numbers, however, could have been influenced by reporting gaps over the recent holidays, and should be interpreted with caution.


And there may also be yet another peak in influenza activity later in the year, particularly if the H3N2 virus should pick up steam.


The following chart suggests the number of consults for ILIs (influenza-like-illnesses) may have peaked at roughly half the level of the disastrous 1999-2000 flu season  – although once again, this dip could be an artifact of reduced reporting over the holidays.


image

It will take another couple of weeks before we can know if these trends are real and sustainable.


And as always, numbers like the 112 deaths should be taken with a large grain of salt, as not every flu-related death is attributed to the virus. 


Some excerpts from this week’s report follow:


HPA National Influenza Report

A full report will be published weekly.  For further information in the surveillance schemes mentioned in this report, please see the Sources of UK Flu Data page.


Figures (including all those found in this report) displaying data from these schemes are available to download as a pdf file:


HPA Weekly National Influenza Graphs (PDF, 685 KB)


PDF versions of previous reports are available on the archive page.

This week's report is available as a pdf:

HPA Weekly National Influenza Report - week 2 (2011) (PDF, 344 KB)

Report published 13 January 2011

Summary

GP and school closures over the Christmas/New Year period will have affected surveillance indicators so all data should be interpreted with caution.  Indeed, several influenza indicators have apparently plateaued.  GP consultation rates remain above baseline levels in all four countries. Influenza A H1N1 (2009) and B are the predominant circulating viruses with few, sporadic A (H3N2) viruses detected.  The H1N1 (2009) virus strain is virologically and epidemiologically similar to that seen during the pandemic.  The virus strains circulating are overall well matched to the current influenza vaccine.

  • In week 1 (ending 9 January), the weekly influenza/influenza-like illness (ILI) consultation rates increased in England (108.4 per 100,000), Scotland (55.8 per 100,000), Wales (92.8 per 100,000) and Northern Ireland (274.4 per 100,000).
  • The weekly national proportions of NHS Direct calls for cold/flu and fever have decreased in week 1.
  • Eleven acute respiratory disease outbreaks were reported in UK in week 1, three in care homes, two in hospitals, five in prisons and one in a primary school.  This brings the total reported this season so far to 146. 
  • Seventy-six of 156 (48.7%) specimens from patients with ILI presenting to sentinel GPs in England in week 1, were reported as positive for influenza.  The proportion of specimens reported to DataMart (England) as positive for influenza decreased to 27.8% (1,104 of 3,968).  The proportion of samples positive for RSV decreased slightly and was low for rhinovirus, parainfluenza, adenovirus and HMPV. 
  • Currently the main circulating influenza strains are influenza A (H1N1) and influenza B.
  • From week 36, 112 deaths associated with influenza infection have been reported. 
  • By week 1, the proportion of people in England aged over 65 years who had received the 2010/11 influenza vaccine was 70.8%. For those in a risk group aged under 65 it was 46.3%.
  • In Europe, several countries are continuing to report increasing influenza activity, primarily associated with influenza A H1N1 (2009).  In the USA influenza activity has decreased slightly but continued to increased in Canada.  In North America influenza A (H3N2) and B viruses have been predominant.

Thursday, December 23, 2010

CDC FluView Week 50


# 5173


The CDC’s FluView weekly surveillance report is out a day early this week due to the Holiday weekend, and it paints a picture of slowly rising, but still relatively low flu activity around the nation.


There are exceptions, of course.  Particularly in the Southeastern states.


P&I (Pneumonia & Influenza) deaths remain below the epidemic threshold, and H3N2 and Influenza B are the most dominant strains.


Some excerpts follow, but follow the link to read the report in its entirety.


Click on map to launch interactive tool


2010-2011 Influenza Season Week 50 ending December 18, 2010

All data are preliminary and may change as more reports are received.

Synopsis:

During week 50 (December 12-18, 2010), influenza activity in the United States increased.

  • Of the 4,733 specimens tested by U.S. World Health Organization (WHO) and National Respiratory and Enteric Virus Surveillance System (NREVSS) collaborating laboratories and reported to CDC/Influenza Division, 744 (15.7%) were positive for influenza.
  • The proportion of deaths attributed to pneumonia and influenza (P&I) was below the epidemic threshold.
  • No influenza-associated pediatric deaths were reported
  • The proportion of outpatient visits for influenza-like illness (ILI) was 2.1%, which is below the national baseline of 2.5%. One of the 10 regions (Region 4) reported ILI above region-specific baseline levels; three states (Alabama, Georgia, and Mississippi) experienced high ILI activity, New York City and two states experienced moderate ILI activity, two states experienced low ILI activity, and the District of Columbia and 43 states experienced minimal ILI activity.
  • The geographic spread of influenza in one state (Mississippi) was reported as widespread, Puerto Rico and 13 states reported regional activity, seven states reported local activity; the District of Columbia, Guam, and 28 states reported sporadic activity, one state reported no influenza activity, and the U.S. Virgin Islands did not report.


U.S. Virologic Surveillance:

WHO and NREVSS collaborating laboratories located in all 50 states and Washington D.C. report to CDC the number of respiratory specimens tested for influenza and the number positive by influenza type and subtype. The results of tests performed during the current week are summarized in the table below.

image


Pneumonia and Influenza (P&I) Mortality Surveillance

During week 50, 6.7% of all deaths reported through the 122-Cities Mortality Reporting System were due to P&I. This percentage was below the epidemic threshold of 7.4% for week 50.

Pneumonia And Influenza Mortality

Outpatient Illness Surveillance:

Nationwide during week 50, 2.1% of patient visits reported through the U.S. Outpatient Influenza-like Illness Surveillance Network (ILINet) were due to influenza-like illness (ILI). This percentage is below the national baseline of 2.5%.


national levels of ILI and ARI

Thursday, December 16, 2010

UK: HPA Influenza Report Week 50


# 5152


Given the recent reports of severe influenza cases occurring in the UK, for the next few weeks I’ll try to feature the Health Protection Agency’s (HPA)  Weekly Influenza Report along with my usual coverage of the CDC’s  FluView report.


You can download this week’s report as a PDF File at:

HPA Weekly National Influenza Report - week 50 (2010) (PDF, 317 KB)


Links, and some excerpts from today’s report follow (bolding and reparagraphing added):


HPA National Influenza Report

Summary

Influenza activity is increasing; GP consultation rates are now above baseline levels in England. Outbreaks and severe cases, mainly in people aged under 65 years, continue to be reported.

Influenza A H1N1 (2009) and B are the predominant circulating viruses with few, sporadic A (H3N2) viruses detected.


The H1N1 (2009) virus strain is virologically and epidemiologically similar to that seen during the pandemic.  The virus strains circulating are well matched to the current influenza vaccine and very little antiviral resistance has been detected.  The HPA expects to see continued elevated influenza activity for several weeks.

  • In week 49 (ending 12 December), the weekly influenza/influenza-like illness (ILI) consultation rates increased to above baseline levels in England (34.6 per 100,000).  The rates have increased but remain below the baseline in Wales (22.5 per 100,000), Scotland (36.1 per 100,000) and Northern Ireland (29.2 per 100,000).  Consultation rates for acute bronchitis also increased.
  • Fifty-seven acute respiratory disease outbreaks were reported in UK in week 49, 55 schools, one care home and one hospital.  This brings the total reported this season so far to 88.
  • Eighty-four of 149 (56.4%) specimens from patients with ILI presenting to sentinel GPs in England in week 49, were reported as positive for influenza.  The proportion of specimens reported to DataMart (England) as positive for influenza has increased to 26.9% (355 of 1,320).  The proportion of samples positive for RSV and rhinovirus are decreasing. 
  • All influenza viruses characterised have been found to be similar to the vaccine strains.
  • Severe cases requiring ICU/ECMO admission have been reported.  From week 36, 17 deaths associated with influenza infection have been reported.  The majority of severe cases reported are aged under 65.

<SNIP>  

 
Microbiological surveillance

The majority of influenza viruses detected have been influenza A H1N1 (2009) and influenza B with few influenza A (H3N2) viruses.


Of 1,320 respiratory specimens reported to the English Data Mart system as taken in week 49, 355 (26.9%) were positive for influenza (271 H1N1 (2009), seven influenza A not subtyped and 77 influenza B) (figure 7).


The proportion positive for respiratory syncytial virus (RSV) and rhinovirus have decreased (from 23.2% to 16.1% and 13.6% to 9.5% respectively).

Figure 7: DataMart samples positive for influenza, England

Figure 7: DataMart samples positive for influenza, England

  (Continue . . . . )


To try to put the current level of influenza-like-illness activity into perspective, I’ve selected a graph from the HPA’s Influenza Surveillance Graphs pdf file.


The consultation rate for ILIs (influenza-like Illnesses) in the UK have more than doubled over the past week, illustrating just how quickly the situation can change.


As chart below shows - while elevated and rising - so far the rate is still well below what was seen during the peak of the 2009 pandemic, or during the extremely severe flu season of 1999-2000.


image

The red line indicates this year’s activity.

 
While I was working on putting this post together, Robert Roos of CIDRAP posted a useful overview of today’s influenza surveillance report which you can read at:


UK leads way as flu activity rises in Europe

Robert Roos * News Editor

Dec 16, 2010 (CIDRAP News) – The United Kingdom is on the leading edge of an increase in influenza activity in Europe, with 57 respiratory disease outbreaks and an increase in critically ill patients and deaths reported in the country last week, according to the UK Health Protection Agency (HPA).

(Continue . . .)

Saturday, October 16, 2010

FluView Week 40


# 4984


The CDC’s FluView report has been on hiatus over the summer, as influenza activity is generally too low to warrant constant surveillance (last summer, when novel H1N1 erupted, was an exception).


It is early fall again in the Northern hemisphere; schools are back in session, the sun’s rays are less direct, temps and the humidity are dropping, and seasonal influenza is beginning to make its yearly appearance.


So every week, through the end of flu season next May, we will get a detailed (early) look at the latest influenza numbers via the CDC’s FLUVIEW report.  


I only post a few highlights each week. Follow the link to read the entire report, or visit the CDC’s Flu Activity & Surveillance page to access the archive of older weekly reports going back a decade.


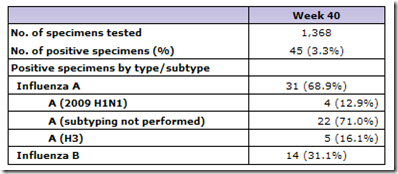
While flu activity remains low, the report indicates it is starting to rise – and perhaps most significantly (and as we’ve been anticipating over the summer) – the H3N2 virus appears to account for a significant portion of the influenza strains being identified.


2010-2011 Influenza Season Week 40 ending October 9, 2010

All data are preliminary and may change as more reports are received.

Synopsis:

Influenza A (H3N2), 2009 influenza A (H1N1), and influenza B viruses co-circulated at low levels in the United States during the summer months. During week 40 (October 3-9, 2010), influenza activity was low in the U.S.

  • Forty-five (3.3%) specimens tested by U.S. World Health Organization (WHO) and National Respiratory and Enteric Virus Surveillance System (NREVSS) collaborating laboratories and reported to CDC/Influenza Division were positive for influenza.
  • The proportion of deaths attributed to pneumonia and influenza (P&I) was below the epidemic threshold.
  • No influenza-associated pediatric deaths were reported.
  • The proportion of outpatient visits for influenza-like illness (ILI) was below the national baseline. All 10 regions reported ILI below region-specific baseline levels and all 48 states with sufficient data experienced minimal ILI activity.
  • Geographic spread of influenza in the District of Columbia, Guam, Puerto Rico, and 19 states was assessed as sporadic, 31 states reported no influenza activity and the U.S. Virgin Islands did not report.


U.S. Virologic Surveillance:

WHO and NREVSS collaborating laboratories, located in all 50 states and Washington, D.C., report to CDC the number of respiratory specimens tested for influenza and the number positive by influenza type and subtype. The results of tests performed during the current week are summarized in the table below.

image

INFLUENZA Virus Isolated

Pneumonia and Influenza (P&I) Mortality Surveillance

During week 40, 6.5% of all deaths reported through the 122-Cities Mortality Reporting System were due to P&I. This percentage was below the epidemic threshold of 6.6% for week 40.

Pneumonia And Influenza Mortality

ILINet State Activity Indicator Map:

Data collected in ILINet are used to produce a measure of ILI activity* by state. Activity levels are based on the percent of outpatient visits in a state due to ILI and are compared to the average percent of ILI visits that occur during spring and fall weeks with little or no influenza virus circulation.


Over the summer the CDC antigenically analyzed 63 influenza isolates (23 novel H1N1, 24 H3N2, 16 influenza B) and determined that:

  • (95.7%) of the H1N1 viruses tested were closely related to the H1N1 (A/California/7/2009-like) component of this year’s flu shot.
  • (91.7%) of the H3N2 viruses tested were closely related to the H3N2 (A/Perth/16/2009-like) component of this year’s flu shot.
  • (75%) of the influenza B viruses tested were closely related  to the B/Brisbane/60/2008-like strain component of this year’s flu shot.


All in all, a pretty good sign that this year’s flu shot ought to be effective against the majority of influenza viruses currently in circulation.

Saturday, March 20, 2010

CDC FluView Week 10


# 4450


Influenza Activity in the United States continues well below what might be normally expected this time of year, as shown by this week’s FluView report.


Only three Southeastern states (Alabama, Mississippi, and Georgia) are reporting regional outbreaks, with surrounding southern states reporting local outbreaks.


image


While pandemic influenza activity in the US is at a very low level, according to the World Health Organization’s latest report (Pandemic Update 92):


The most active areas of pandemic influenza transmission continue to be in Southeast Asia and West Africa. Limited data suggests that pandemic influenza activity may be increasing across parts of Central America and the Caribbean. Low levels of pandemic influenza virus continue to circulate across southern and south-eastern Europe and in East, West, and South Asia. Although pandemic influenza virus continues to be the predominant influenza virus circulating worldwide, seasonal influenza B viruses are predominate in East Asia, and have been detected at low levels across southeast Asia and eastern Africa.


For the full report of the latest US data, visit the weekly FluView  update page.  Here are a few excerpts.


2009-2010 Influenza Season Week 10 ending March 13, 2010

All data are preliminary and may change as more reports are received.

Synopsis:

During week 10 (March 7-13, 2010), influenza activity remained at approximately the same levels as last week in the U.S.

  • 200 (5.6%) specimens tested by U.S. World Health Organization (WHO) and National Respiratory and Enteric Virus Surveillance System (NREVSS) collaborating laboratories and reported to CDC/Influenza Division were positive for influenza.
  • All subtyped influenza A viruses reported to CDC were 2009 influenza A (H1N1) viruses.
  • The proportion of deaths attributed to pneumonia and influenza (P&I) was below the epidemic threshold.
  • Two influenza-associated pediatric deaths were reported. One death was associated with 2009 influenza A (H1N1) virus infection and one death was associated with an influenza A virus for which the subtype was undetermined.
  • The proportion of outpatient visits for influenza-like illness (ILI) was 1.8%, which is below the national baseline of 2.3%. One of 10 regions (Region 4) reported ILI above its region-specific baseline level.
  • No states reported widespread influenza activity. Three states reported regional influenza activity. Puerto Rico and eight states reported local influenza activity. The District of Columbia, Guam and 31 states reported sporadic influenza activity. Eight states reported no influenza activity, and the U.S. Virgin Islands did not report.

U.S. Virologic Surveillance:

WHO and NREVSS collaborating laboratories located in all 50 states and Washington, D.C. report to CDC the number of respiratory specimens tested for influenza and the number positive by influenza type and subtype. The results of tests performed during the current week are summarized in the table below.

image

Pneumonia and Influenza (P&I) Mortality Surveillance

During week 10, 7.3% of all deaths reported through the 122-Cities Mortality Reporting System were due to P&I. This percentage was below the epidemic threshold of 7.9% for week 10.

Pneumonia And Influenza Mortality

Influenza-Associated Pediatric Mortality

Two influenza-associated pediatric deaths were reported to CDC during week 10 (Oklahoma and Texas). One death was associated with 2009 influenza A (H1N1) virus infection and one death was associated with an influenza A virus for which the subtype was undetermined. The deaths reported during week 10 occurred January 31 and February 27, 2010.

Influenza-Associated Pediatric Mortality

Outpatient Illness Surveillance:

Nationwide during week 10, 1.8% of patient visits reported through the U.S. Outpatient Influenza-like Illness Surveillance Network (ILINet) were due to influenza-like illness (ILI). This percentage is below the national baseline of 2.3%.


national levels of ILI and ARI

Sunday, March 07, 2010

CDC FluView Week 8


# 4411


Key Influenza indicators for the latest reporting period (ending February 27th) remained about the same as in the previous week, with P&I deaths slightly elevated over week 7, but still below the epidemic threshold for this time of year.    


Visits to doctors for ILI (influenza-like illnesses) are on the decline, and the vast majority (93.6%) of samples submitted to the CDC did not test positive for influenza.    Other respiratory viruses, such as RSV, adenovirus, and Rhinoviruses are undoubtedly contributing to the mix.


Perhaps the most hopeful sign is that only one flu-related pediatric death was reported, and this was a delayed report from last year and did not involve the H1N1 virus.


A brief summary, therefore, of this week’s FluView highlights.  Follow the link to read the entire weekly update.


2009-2010 Influenza Season Week 8 ending February 27, 2010

All data are preliminary and may change as more reports are received.

Synopsis:

During week 8 (February 21-27, 2010), influenza activity remained at approximately the same levels as last week in the U.S.

  • 263 (6.4%) specimens tested by U.S. World Health Organization (WHO) and National Respiratory and Enteric Virus Surveillance System (NREVSS) collaborating laboratories and reported to CDC/Influenza Division were positive for influenza.
  • Over 99% of all subtyped influenza A viruses reported to CDC were 2009 influenza A (H1N1) viruses.
  • The proportion of deaths attributed to pneumonia and influenza (P&I) was below the epidemic threshold.
  • One influenza-associated pediatric death was reported and was associated with an influenza B virus infection. This death occurred during the 2008-09 influenza season.
  • The proportion of outpatient visits for influenza-like illness (ILI) was 1.7% which is below the national baseline of 2.3%. Two of 10 regions (Regions 4 and 9) reported ILI above region-specific baseline levels.
  • No states reported widespread influenza activity, four states reported regional influenza activity, Puerto Rico and eight states reported local influenza activity, the District of Columbia, Guam, and 34 states reported sporadic influenza activity, four states reported no influenza activity, and the U.S. Virgin Islands did not report.

U.S. Virologic Surveillance:

WHO and NREVSS collaborating laboratories located in all 50 states and Washington, D.C. report to CDC the number of respiratory specimens tested for influenza and the number positive by influenza type and subtype. The results of tests performed during the current week are summarized in the table below.

image

INFLUENZA Virus Isolated

Pneumonia and Influenza (P&I) Mortality Surveillance

During week 8, 7.8% of all deaths reported through the 122-Cities Mortality Reporting System were due to P&I. This percentage was below the epidemic threshold of 7.9% for week 8.

Pneumonia And Influenza Mortality

Influenza-Associated Pediatric Mortality

One influenza-associated pediatric deaths was reported to CDC during week 8 (Florida). This death was associated with an influenza B virus infection that occurred in February 2009. This brings the total number of reported pediatric deaths occurring during the 2008-09 season to 133.

Influenza-Associated Pediatric Mortality

Outpatient Illness Surveillance:

Nationwide during week 8, 1.7% of patient visits reported through the U.S. Outpatient Influenza-like Illness Surveillance Network (ILINet) were due to influenza-like illness (ILI). This percentage is below the national baseline of 2.3%.

image

Friday, February 19, 2010

CDC FluView Week 6


# 4364


Key Influenza indicators for the latest reporting period (ending February 13th) remained about the same as in the previous week, with P&I deaths slightly elevated, but still below the epidemic threshold for this time of year.    


Visits to doctors for ILI (influenza-like illnesses) increased slightly, but the vast majority (96.5%) of samples submitted to the CDC did not test positive for influenza.    Other respiratory viruses, such as RSV, adenovirus, and Rhinoviruses are undoubtedly contributing to the mix.


A brief summary, therefore, of this week’s FluView highlights.  Follow the link to read the entire weekly update.


2009-2010 Influenza Season Week 6 ending February 13, 2010

All data are preliminary and may change as more reports are received.

Synopsis:

During week 6 (February 7-13, 2010), influenza activity remained at approximately the same levels as last week in the U.S.

  • 129 (3.5%) specimens tested by U.S. World Health Organization (WHO) and National Respiratory and Enteric Virus Surveillance System (NREVSS) collaborating laboratories and reported to CDC/Influenza Division were positive for influenza.
  • All subtyped influenza A viruses reported to CDC were 2009 influenza A (H1N1) viruses.
  • The proportion of deaths attributed to pneumonia and influenza (P&I) was below the epidemic threshold.
  • Two influenza-associated pediatric deaths were reported. Both deaths were associated with 2009 influenza A (H1N1) virus infection.
  • The proportion of outpatient visits for influenza-like illness (ILI) was 2.1% which is below the national baseline of 2.3%. Three of 10 regions (Regions 4, 7, and 9) reported ILI above region-specific baseline levels.
  • No states reported widespread influenza activity, three states reported regional influenza activity, Puerto Rico and nine states reported local influenza activity, the District of Columbia and 35 states reported sporadic influenza activity, the U.S. Virgin Islands and three states reported no influenza activity, and Guam did not report.

U.S. Virologic Surveillance:

WHO and NREVSS collaborating laboratories located in all 50 states and Washington, D.C. report to CDC the number of respiratory specimens tested for influenza and the number positive by influenza type and subtype. The results of tests performed during the current week are summarized in the table below.

image

Pneumonia and Influenza (P&I) Mortality Surveillance

During week 6, 7.7% of all deaths reported through the 122-Cities Mortality Reporting System were due to P&I. This percentage was below the epidemic threshold of 7.8% for week 6.

Pneumonia And Influenza Mortality

Influenza-Associated Pediatric Mortality

Two influenza-associated pediatric deaths were reported to CDC during week 6 (Georgia and New York). Both deaths were associated with 2009 influenza A (H1N1) virus infection. The deaths reported during week 6 occurred between January 31 and February 6, 2010.


Influenza-Associated Pediatric Mortality

Sunday, February 07, 2010

Weekly Roundup Of Flublogia


# 4330


Once again I’m back with a recap of some of the stories from in and around Flublogia (and or science blogs) from the past couple of weeks.


This is a subjective list of things that I found of interest, and by no means mentions every worthy blog post out there.  It is more of a sampling, and not always restricted to flu.


My apologies for the good stories I may miss.  So, with that said, in no particularly order . . .


This weekend marks the fourth anniversary of the opening of the FluTrackers forum, and so congratulations are in order to Sharon Sanders, Sally, Jeremy - and to the dozens of moderators and advisors who help keep the wheels on the track - and of course to all of the members.    


FluTrackers, despite its name, follows more than just influenza.  It has become an enormous online repository of information on all manner of emerging infectious diseases, and is one I avail myself of often.


Although Revere at Effect Measure has been occupied with writing a major grant proposal, he has managed to find time to take Wolfgang Wodarg to the woodshed over his allegations against the World Health Organization and has offered up an assessment of the  CDC’s epidemiology efforts over the past year.


Fire in the hole: Wolfgang Wodarg and WHO

Random thoughts on CDC's swine flu effort: epidemiology and surveillance


Maryn McKenna’s Superbug Blog was named a top 50 Health Blog (and deservedly so) by he website The Science of Health, sharing honors with other deserving recipients including Effect Measure and The Pump Handle.


Her latest entry concerns budget cuts that will reduce or eliminate critical MRSA surveillance projects:

Bad news in the President's budget request


Three other entries of note include:


Recommending: Consumer Reports on hospital infections

Back again to MRSA in animals, and spreading to humans

Once again, flu and bacterial co-infection


Vincent Racaniello’s Virology Blog continues to provide us with videos of his Columbia University Virology Lectures (up to #5 now), along with access to TWiV his (This week In Virology) and TWiP (This week in Parasitism) podcasts. 


Professor Ian York’s  Mystery Rays from Outer Space blog is an eclectic collection of short science essays, and often takes me in unexpected directions.  Three diverse examples from the past ten days include:


Tumors as ecosystems

Virus discovery by jigsaw puzzle

Viral resistance and new functions


Crof over at Crofsblog has been doing some housekeeping and rearranging of his site, along with first class news gathering.  He also offered his evaluation of a recent contrarian editorial in Annals of viral paranoia VI: Fumento on WHO's real motives.


Newshounds on the flu forums (I frequent the Flu Wiki and FluTrackers) have been dealing with fresh reports of bird flu cropping up in Indonesia, Cambodia, India, Bangladesh, Malaysia and Egypt, along with the latest development with pandemic H1N1, and other emerging infectious diseases.  


As I’ve stated many times, this blog is highly dependent upon their hard work, and I try to highlight them whenever possible. 


Three that have been kept particularly busy over the past couple of weeks have been Ida at BFIC, Commonground at Pandemic Information News, and Paul at Chen Qi.  My thanks go to them, and the rest of the newshounds that are doing the heavy lifting of finding and translating news stories.


Some of my efforts over the past couple of weeks include:


At The Sound Of The Tone
Neurologic Manifestations of Pandemic (H1N1) 2009 Virus Infection
IgG2 and Flu
Indonesia: Changes In The H5N1 Virus
I Only Have Eyes For Flu
Contrarians At The Gate


Hopefully you’ll find something in this roundup you missed the first time round.

Friday, February 05, 2010

CDC: FluView 2010 Week 4


# 4326


The key indicators for influenza activity around the country remained roughly the same in the latest reporting period as they were in week 2 and 3. 


For the third consecutive week the P&I (pneumonia & influenza) Mortality levels remain above the epidemic threshold for this time of year.   Not all  P&I deaths can be attributed to influenza, however.


There were 9 influenza-related pediatric fatalities added last week, although roughly half appear to be older cases from 2009.


Overall, US flu activity continues to be considerably below the levels we saw last October and well below normal for this time of year.


Below you’ll find some excerpts from the CDC’s weekly FluView  report. Follow the link to read it in its entirety.


2009-2010 Influenza Season Week 4 ending January 30, 2010

All data are preliminary and may change as more reports are received.

Synopsis:

During week 4 (January 24-30, 2010), influenza activity remained at approximately the same levels as last week in the U.S.

  • 119 (3.2%) specimens tested by U.S. World Health Organization (WHO) and National Respiratory and Enteric Virus Surveillance System (NREVSS) collaborating laboratories and reported to CDC/Influenza Division were positive for influenza.
  • All subtyped influenza A viruses reported to CDC were 2009 influenza A (H1N1) viruses.
  • The proportion of deaths attributed to pneumonia and influenza (P&I) was above the epidemic threshold.
  • Nine influenza-associated pediatric deaths were reported. Eight deaths were associated with 2009 influenza A (H1N1) virus infection and one was associated with an influenza A virus for which the subtype was undetermined.
  • The proportion of outpatient visits for influenza-like illness (ILI) was 1.9% which is below the national baseline of 2.3%. All regions reported ILI below their region-specific baseline.
  • No states reported widespread influenza activity, six states reported regional influenza activity, Puerto Rico and 10 states reported local influenza activity, the District of Columbia, Guam, and 31 states reported sporadic influenza activity, and the U.S. Virgin Islands and three states reported no influenza activity.

U.S. Virologic Surveillance:

WHO and NREVSS collaborating laboratories located in all 50 states and Washington, D.C. report to CDC the number of respiratory specimens tested for influenza and the number positive by influenza type and subtype. The results of tests performed during the current week are summarized in the table below.

image

Pneumonia and Influenza (P&I) Mortality Surveillance

During week 4, 8.1% of all deaths reported through the 122-Cities Mortality Reporting System were due to P&I. This percentage was above the epidemic threshold of 7.8% for week 4, and is the third consecutive week that the percentage of P&I deaths has been above the epidemic threshold.

Pneumonia And Influenza Mortality


Influenza-Associated Pediatric Mortality

Nine influenza-associated pediatric deaths were reported to CDC during week 4 (Colorado, California [6], Mississippi, and Texas). Eight deaths were associated with 2009 influenza A (H1N1) virus infection and one was associated with an influenza A virus for which the subtype was undetermined. The deaths reported during week 4 occurred between October 18, 2009 and January 23, 2010.

Influenza-Associated Pediatric Mortality

Outpatient Illness Surveillance:

Nationwide during week 4, 1.9% of patient visits reported through the U.S. Outpatient Influenza-like Illness Surveillance Network (ILINet) were due to influenza-like illness (ILI). This percentage is below the national baseline of 2.3%.


national levels of ILI and ARI

Friday, January 29, 2010

CDC: FluView 2010 Week 3


# 4306


The key indicators for influenza activity around the country remained roughly the same in the latest reporting period as they were in week 2. 


Once again the P&I (pneumonia & influenza) Mortality levels remain above the epidemic threshold for this time of year.   Not all  P&I deaths can be attributed to influenza, however.


Overall, US flu activity continues to be considerably below the levels we saw last October and well below normal for this time of year.


Below you’ll find some excerpts from the CDC’s weekly FluView  report. Follow the link to read it in its entirety.


2009-2010 Influenza Season Week 3 ending January 23, 2010

All data are preliminary and may change as more reports are received.

Synopsis:

During week 3 (January 17-23, 2010), influenza activity remained at approximately the same levels this week in the U.S.

  • 164 (4.6%) specimens tested by U.S. World Health Organization (WHO) and National Respiratory and Enteric Virus Surveillance System (NREVSS) collaborating laboratories and reported to CDC/Influenza Division were positive for influenza.
  • All subtyped influenza A viruses reported to CDC were 2009 influenza A (H1N1) viruses.
  • The proportion of deaths attributed to pneumonia and influenza (P&I) was above the epidemic threshold.
  • Five influenza-associated pediatric deaths were reported. Four deaths were associated with 2009 influenza A (H1N1) virus infection and one was associated with an influenza A virus for which the subtype was undetermined.
  • The proportion of outpatient visits for influenza-like illness (ILI) was 1.7% which is below the national baseline of 2.3%. Two of the 10 regions (Regions 4 and 9) reported ILI equal to their region-specific baseline.
  • No states reported widespread influenza activity, five states reported regional influenza activity, Puerto Rico and nine states reported local influenza activity, the District of Columbia, Guam, and 33 states reported sporadic influenza activity, and the U.S. Virgin Islands and three states reported no influenza activity.

U.S. Virologic Surveillance:

WHO and NREVSS collaborating laboratories located in all 50 states and Washington D.C., report to CDC the number of respiratory specimens tested for influenza and the number positive by influenza type and subtype. The results of tests performed during the current week are summarized in the table below.

image

Pneumonia and Influenza (P&I) Mortality Surveillance

During week 3, 8.3% of all deaths reported through the 122-Cities Mortality Reporting System were due to P&I. This percentage was above the epidemic threshold of 7.7% for week 3, and is the second consecutive week that the percentage of P&I deaths has been above the epidemic threshold.

Pneumonia And Influenza Mortality

Influenza-Associated Pediatric Mortality

Five influenza-associated pediatric deaths were reported to CDC during week 3 (New York [4] and Wisconsin). Four deaths were associated with 2009 influenza A (H1N1) virus infection and one was associated with an influenza A virus for which the subtype was undetermined. The deaths reported during week 3 occurred between November 8, 2009 and January 2, 2010.

Influenza-Associated Pediatric Mortality

Monday, January 25, 2010

Weekly Roundup Of Flublogia


# 4286


Once again I’m back with a recap of some of the stories from in and around Flublogia (and or science blogs) from the past week (or so).


This is a subjective list of things that I found of interest, and by no means mentions every worthy blog post out there.  It is more of a sampling, and not always restricted to flu.


My apologies for the good stories I may miss.  So, with that said, in no particularly order . . .


We start this roundup with two pieces by Maryn McKenna on how MRSA is introduced and spread in a hospital environment.   The first appeared on CIDRAP (see New tool helps trace MRSA's local, global spread) and the second was a follow up blog post on Maryn’s Superbug Blog.


Maryn also shared with us a sneak peek at the cover art for her upcoming book on MRSA.   Congratulations, Maryn. 


Next up are two pieces by the Reveres at Effect Measure.


The first looks at attempts to define (and possibly control) the tools (at a cellular level)  that influenza viruses need in order to replicate.  In New tool to figure out what the flu virus does (and what it needs to do it), Revere looks at research that may lead someday to new types of antivirals.


In Another swine flu virus, the authors of Effect Measure look at the recent report that boy in Iowa recently (last September) contracted an H3N2 version of swine flu.   While no further spread has been detected, the Reveres remind us of why surveillance of these types of viruses is so important.


You can find my post on this story at H3N2 Swine Flu.


Although we’ve dozens of terrific newshounds working the Flu and Emerging Infectious Disease beat, I’d like to call your attention to two of them this morning, and their respective websites.


First is Ida at The Bird Flu Information Corner.


BFIC is a joint effort between Kobe University in Japan and the Institute of Tropical Disease, Airlangga University, Indonesia  and provides us with some of the best coverage and translations of Indonesian (Bahasan) news stories on the web.


Second is Commonground at Pandemic Information News.


Commonground is one of the most active of the flu forum newshounds, and posts at FluTrackers as well as on her own site.   She often finds and publishes foreign language stories out of Egypt, Vietnam, Indonesia (and other countries) days before the English language media picks up on them.


When you combine their work with that of dozens of others on flu forums (I follow the Flu Wiki and FluTrackers), you end up with a pretty effective news retrieval system. The time, patience, and expertise required to find, translate, and interpret these news stories in enormous.


My thanks and kudos go to all of the newshounds.


Another blog post that caught my eye this past week (I’m a sucker for disease history) was one from Professor Ian York at Mystery Rays from Outer Space.


In The good old days   York unveils some very old disease maps of the United States and the West Indies (circa 1856). 


image


While the reporting from CIDRAP news is always top-notch, a detailed examination of the Michigan Facemask/Hand Hygiene study by news Editor Robert Roos belongs near the top of my list of essential reading this week.


Masks plus hand hygiene reduced ILI in college dorm study


Of course, for the best daily news summary, I can think of no better stop than to visit Crof at Crofsblog.  And for news stories on a variety of infectious diseases, along with the latest out of Haiti, I’d direct you to Chen Qi.


A few of my own contributions this week to the Blogosphere include:


AFD’s Fourth Blogiversary
Study: H1N1 And Birds
Study: Effectiveness of NPIs Against ILI's
The MRSA Beat
Flu’s Double Whammy


Hopefully I’ve mentioned something you may have missed over the past week.