Showing posts sorted by relevance for query Florida COVID-19. Sort by date Show all posts

Saturday, March 07, 2020

Florida DOH: 2 New COVID-19 Cases - 2 Deaths

Fl COVID-19 Stats 10pm March 6th


#15,049

Florida, with 20 million residents and tens of millions of visitors each year, has been testing for COVID-19 for barely a week, and only 5 days ago confirmed their 1st  2 Presumptive Positive COVID-19 Cases
Testing, however, remains quite limited (100 negative results, 6 positive), and so we really have no idea how prevalent the virus might be in our population.  This deficit in testing is not unique to Florida, or to the United States. 
Overnight, however, we've learned of two new COVID-19 cases, and two deaths.  This from Florida's Department of Health.
Department of Health Announces Important Updates Regarding Covid-19 in Florida - Two Confirmed Deaths Regarding Covid-19
March 06, 2020

Contact:
Communications Office
NewsMedia@flhealth.gov(850) 245-4111
Tallahassee, Fla. — The Florida Department of Health has announced updates regarding the 2019 coronavirus disease (COVID-19) in Florida. Two individuals have died and two new presumptive positive cases have been identified in Broward County.
Deceased Individuals
A previously announced COVID-19 patient in Santa Rosa County has died, following an international trip.
A new individual in their seventies that tested presumptive positive for COVID-19 in Lee County has died, following an international trip.
New Presumptive Positive Cases
A 75-year old male in Broward County has been identified as a presumptive positive. This person is isolated and will continue to remain isolated until cleared by public health officials.
A 65-year old male in Broward County has been identified as a presumptive positive. This person is isolated and will continue to remain isolated until cleared by public health officials.
The Florida Department of Health is working closely with the patients, potential close contacts of each case and health care providers to isolate and monitor persons who may have been exposed to COVID-19 and implement testing of anyone who may develop COVID-19 symptoms, including fever, cough or shortness of breath.
(Continue . . . )

While the number of confirmed cases in Florida remains reassuringly small - at least when compared to Washington State (n=79) and New York (n=44) - the limited testing to date leaves a lot of room for undetected cases, and deaths.

This is flu season, we have a large elderly population, and many people are hospitalized with ILIs (Influenza-Like-Illnesses).  Having worked as a paramedic here, I can attest to the fact that hundreds of (mostly) elderly people die of `natural causes' each day - and the cause of death is almost never confirmed.
This is why it is so hard to tell how many people die from the flu each year.  Influenza almost never appears on a death certificate as a primary cause of death.
If the patient is elderly, and there are no `unusual circumstances' surrounding the death, the patient's doctor generally signs the death certificate, attributing COD to heart attack, stroke, COPD, or other chronic condition.
As we've discussed often, heart attacks and strokes are linked to recent flu infections (see Eur. Resp.J.: Influenza & Pneumonia Infections Increase Risk Of Heart Attack and Stroke) and most of those deaths are attributed to cardiovascular - not viral - causes.   
Two weeks ago, Italy and Iran were both posting reassuringly low, double digit COVID-19 case counts. Today, those two countries have identified close to 10,000 cases, a great many of which were already infected when their surveillance was still reporting only a handful of cases. 

Even when we have point-of-care diagnostics and excellent lab testing and surveillance - as we do for influenza - the CDC can only estimate the number of cases each year, how many of those are hospitalized, and how many deaths.  


So far, this winter, the CDC estimates between 350,000 and 625,000 flu hospitalization and between 20,000 and 52,000 flu deaths. No one is actually counting, and so we end up with a pretty wide range.
Without extensive testing, we have no way of knowing how many of these flu deaths might have been due to COVID-19.  Probably not a huge number yet, but nobody really knows. 
Ten years after the 2009 H1N1 pandemic, researchers are still arguing its impact. Early estimates (see Lancet: Estimating Global 2009 Pandemic Mortality) - released during the pandemic by WHO - now appear to have captured as little as 5% to 7% of the true number of deaths.

We will likely see the same thing happen with COVID-19.  The number of cases, and deaths, reported in real time during the next few months will only reflect a fraction of the true burden.
At best, in a few years, we'll have a crude estimate. Not a count, but a benchmark, to compare COVID-19 to 1918, 1957, 1968 and 2009. 
For now, perhaps the best way to get a crude estimate of the severity of COVID-19 is by the impact it has on hospitals and healthcare delivery, the economic losses attributed to the epidemic, and the severity and duration of societal disruptions.
Governments, and the media, love to report numbers. The public expects them, as they provide a sense of certainty, and of things being under control.
But with infectious diseases - particularly during an epidemic - they should never be assumed to reflect the true burden of an outbreak.

Sunday, October 16, 2022

Myocarditis Following COVID Infection and/or mRNA Vaccination (Revisited)


Credit ACIP/CDC

#17,066

Although most vaccines - including the COVID mRNA vaccines - have an enviable safety record, there is no such thing as a 100% safe drug or medication for 100% of the population. Even over-the-counter remedies, like NSAIDs or acetaminophen, can sometimes produce adverse - even fatal - reactions (see BMJ Research: NSAIDs & The Risk Of Heart Failure).

The decision to take any vaccine or medication always involves a risk-reward calculation. Most of the time, the small risk from a vaccine is justified, given the protection it provides.

Last week the State of Florida released new (and highly criticized) COVID Vaccine guidance (see State Surgeon General Dr. Joseph A. Ladapo Issues New Mrna COVID-19 Vaccine Guidance) advising males aged 18 to 39 against receiving mRNA COVID-19 vaccines, based on an in-house non-peer reviewed risk analysis by the Florida Department of Health. 

For a detailed dissection of Florida's guidance, you may wish to visit Florida’s COVID-19 Vaccination Analysis Is Flawed, Experts Say.

Leaving aside the merits (or lack, thereof) of the Florida's Surgeon General's controversial guidance, two facts are undisputed:

  1. Myocardititis has been reported in some (mostly young) recipients of the mRNA vaccine (see CDC Clinical Considerations : Myocarditis & Pericarditis after Receipt of mRNA COVID-19 Vaccines Among Adolescents and Young Adults)
  2. Myocardititis is a known complication of COVID infection (see Heart disease after COVID: what the data say) 
While this might seem like a damned if you do, and damned if you don't decision, there are studies showing that vaccine-induced myocarditis is generally milder than viral-induced myocarditis, and most people fully recover in 90 days or less. 

And while the distorting echo-chamber of social media may make vaccine-induced myocarditis seem like a common side effect of mRNA vaccination, the reality is less alarming. 

First stop, a preprint from Taiwan, showing  that myocarditis and pericarditis are rare following mRNA vaccination, albeit with a higher risk occurring in young males after the second dose, and concludes that "The benefits of COVID-19 vaccination far outweigh the possible harm for either the individual or society."

Risk of Myocarditis and Pericarditis Following Coronavirus Disease 2019 Messenger RNA Vaccination - A Nationwide Study
Wei-Ju Su, Yu-Lun Liu, Chia-Hsuin Chang, Yen-Ching Lin, Wei-I Huang, Li-Chiu Wu, Shu-Fong Chen, Yu-Sheng Lin, Yee-Lin Hsieh, Chiao-An Yang, Chiu-Hsiang Lin, Kim-Wei Arnold Chan, Ping-Ing Lee, Jen-Hsiang Chuang, Chin-Hui Yang
doi: https://doi.org/10.1101/2022.10.11.22280860
https://www.psu.edu/news/research/story/myocarditis-seven-times-more-likely-covid-19-vaccines/Background. An extended interval between the two primary doses may reduce the risk of myocarditis/pericarditis after COVID-19 mRNA vaccination. Taiwan has implemented a two-dose regimen with a 12-week interval for adolescents. Here we present nationwide data of mRNA COVID-19 vaccination-associated myocarditis and pericarditis in Taiwan.

Methods. Data on adverse events of myocarditis/pericarditis were from the Taiwan Vaccine Adverse Events Reporting System between March 22, 2021, and February 9, 2022. The rates according to sex, age, and vaccine type were calculated. We investigated the reporting rates among young individuals under different two-dose intervals and among those who received two doses of different vaccines.

Results. Among 204 cases who met the case definition of myocarditis/pericarditis, 75 cases occurred after the first dose and 129 after the second. The reporting rate of myocarditis/pericarditis after COVID-19 vaccination varied across sex and age groups and was highest after the second dose in males aged 12-17 years (126.79 cases per million vaccinees) for the BNT162b2 vaccine and in males aged 18-24 years (93.84 cases per million vaccinees) for the mRNA-1273 vaccine. The data did not suggest an association between longer between-dose interval and lower rate of myocarditis/pericarditis among males and females aged 18-24 or 25-29 years who received two doses of the BNT162b2 or mRNA-1273 vaccine. Rates of myocarditis/pericarditis in males and females aged 18-49 years after receiving ChAdOx1-S - mRNA-1273 vaccination was significantly higher than after ChAdOx1-S - ChAdOx1-S vaccination.

Conclusions.
Myocarditis and pericarditis are rare following mRNA vaccination, with higher risk occurring in young males after the second dose.

Additionally, we've a recent study indicating that infection with the SARS-CoV-2 virus is far more likely to cause myocarditis than receipt of the vaccine.  Seven times more likely, according to an analysis by Penn State researchers. 

First some excerpts from a Penn State press release, then a link to their study.  
Myocarditis seven times more likely with COVID-19 than vaccines

OCTOBER 12, 2022


By Tracy Cox

HERSHEY, Pa. — The risk of developing myocarditis — or inflammation of the heart muscle — is seven times higher with a COVID-19 infection than with the COVID-19 vaccine, according to a recent study by Penn State College of Medicine scientists. Patients with myocarditis can experience chest pains, shortness of breath or an irregular heartbeat. In severe cases, the inflammation can lead to heart failure and death.

“Our findings show that the risk of myocarditis from being infected by COVID-19 is far greater than from getting the vaccine,” said Dr. Navya Voleti, a resident physician in the Department of Medicine at Penn State Health Milton S. Hershey Medical Center. “Moving forward, it will be important to monitor the potential long-term effects in those who develop myocarditis.”

Myocarditis is one of the complications of SARS-CoV-2 infection. Although vaccines have been shown to reduce severe COVID-19 symptoms, heart complications have been associated with mRNA COVID-19 vaccination — particularly myocarditis in teenage boys. However, the relative risk of myocarditis due to vaccines and infections had not been well characterized in large studies.
The Penn State team conducted the largest study to date on the risk of developing myocarditis as a result of having the coronavirus vs. experiencing inflammation following COVID-19 vaccination. The researchers compared patients with COVID-19 — vaccinated and unvaccinated — to those without the virus. They found the risk of myocarditis was 15 times higher in COVID-19 patients, regardless of vaccination status, compared to individuals who did not contract the virus.
Next, the researchers separately compared the rates of myocarditis in those who received the vaccines to those in unvaccinated individuals. According to the findings, the rates of myocarditis in people who were vaccinated against COVID-19 were only twofold higher than in unvaccinated people.

Based on all the findings, the researchers concluded that the risk of myocarditis due to COVID-19 was seven times higher than the risk related to the vaccines.

         (Continue . . . )


Myocarditis in SARS-CoV-2 infection vs. COVID-19 vaccination: A systematic review and meta-analysis

Navya Voleti1, Surya Prakash Reddy2 and Paddy Ssentongo1,3*


Were myocarditis the only adverse outcome of COVID infection, then perhaps a case might be made for recommending against mRNA vaccines for young, healthy, males. But COVID produces a wide range of serious, often long lasting sequelae, even in this cohort. 


A few (of many) blogs on this topic include:


While it may not seem like it if you - or someone you know - has an adverse reaction to the mRNA vaccine, the known risks from contracting COVID are demonstrably far greater.  

But we humans are a suspicious lot, and aren't very good at making risk-reward calculations.

So I don't expect these studies to change very many minds. 

Sunday, August 09, 2020

CDC Updated (Aug 6th) COVID-19 Forecasts: Cumulative Deaths & Hospitalizations


#15,406

The CDC continues to expand, and hopefully improve, their (4 week) forecasts for COVID-19 deaths and hospitalizations. The CDC's Forecasts of COVID-19 Deaths this week incorporates a record 34 different modeling groups, and last week added a new feature; forecasts of new deaths in addition to forecasts of total deaths.

Their 4 week hospitalization forecast - which is newer, and less robust than the deaths forecast - utilizes just 8 modeling groups, and continues to produce a wider range of results.

All of these models are based on different assumptions about social distancing, disease transmission rates, and local compliance with recommended control measures, and therefore often come up with widely varying `solutions'.

While important gauges of the intensity and trajectory of the pandemic, deaths and hospitalizations don't begin to tell the full story of the impact of COVID-19. We continue to see reports of very slow return to usual health, and studies showing potentially permanent heart and lung damage among some `recovered' COVID cases. There are also concerns over the diseases's impact on pregnant women and their unborn child, and reports of lingering neurological manifestations among survivors.

Our first stop today, the CDC's forecast on COVID-19 Deaths:

COVID-19 Forecasts: Deaths

Updated Aug. 6, 2020

Observed and forecasted new and total reported COVID-19 deaths as of August 3, 2020.

Interpretation of Forecasts of New and Total Deaths
This week CDC received forecasts of national COVID-19 deaths over the next 4 weeks from 34 modeling groups. Those forecasts predict:

  • The number of new COVID-19 deaths reported each week (32 forecasts), which indicates how reported deaths are likely to increase or decrease in the coming weeks
  • The total number of COVID-19 deaths reported by the end of each week (33 forecasts), which helps us understand the likely overall impact of the pandemic in the coming weeks
Of the 34 modeling groups, 31 provided forecasts of both new and total deaths, one provided forecasts of new deaths only, and two provided forecasts of total deaths only. 
  • This week’s national ensemble forecast predicts that weekly reports of new COVID-19 deaths may decrease over the next 4 weeks, with 4,500 to 10,600 new deaths reported during the week ending August 29. The ensemble forecast predicts that 175,000 to 190,000 total COVID-19 deaths will be reported by August 29.
  • State-level ensemble forecasts predict that the number of reported new deaths per week may increase over the next four weeks in Hawaii and Puerto Rico and may decrease in Florida, Mississippi, New Mexico, the Northern Mariana Islands, Ohio, Texas, Vermont, and the Virgin Islands.
National Forecast


  • The top row of the figure shows the number of new COVID-19 deaths reported in the United States each week from May 30 through August 1 and forecasted new deaths over the next four weeks, through August 29.
  • The bottom row of the figure shows the number of total COVID-19 deaths in the United States each week from May 30 through August 1 and the forecasted number of total COVID-19 deaths over the next four weeks, through August 29. 
Models make various assumptions about the levels of social distancing and other interventions, which may not reflect recent changes in behavior. See model descriptions below for details.

State Forecasts

State-level forecasts figures show observed and forecasted state-level new and cumulative COVID-19 deaths in the US. Each state forecast uses a different scale, due to differences in the numbers of COVID-19 deaths occurring in each state.

Forecasts fall into one of two categories:
  • The Auquan, CMU, DDS, Columbia-UNC, ERDC, ESG, Geneva, GT-DeepCOVID, ISU, Karlen, LANL, LNQ, LSHTM, MIT-CovAlliance, MIT-ORC, MOBS, Oliver Wyman, NotreDame-Mobility, QJHong, RPI-UW, STH, UA, UCM, UM, UMass-MB, USC, and UT forecasts assume that existing control measures will remain in place during the prediction period.
  • The Columbia, COVID19Sim, GT-CHHS, IHME, JCB, JHU, NotreDame-FRED, PSI, UCLA, and YYG forecasts make different assumptions about how levels of social distancing will change in the future. 
Download state forecasts pdf icon[29 pages]1

Download forecast data excel icon[1 sheet]

(Continue . . .)

Our second stop is this week's hospitalization forecast.

COVID-19 Forecasts: Hospitalizations
Updated Aug. 5, 2020

Interpretation of Forecasts of New Hospitalizations
  • This week, three national forecasts predict a likely increase in the number of new hospitalizations per day over the next four weeks, two forecasts predict a likely decline, and three forecasts are either uncertain about the direction of the trend or predict stable numbers. For August 31, the forecasts estimate 2,000 to 12,000 new COVID-19 hospitalizations per day.
  • State-level forecasts also show a high degree of variability, which results from multiple factors. Hospitalization forecasts use different sources of data for COVID-19 cases or deaths, with different limitations, and make different assumptions about social distancing.
National Forecast

  • The eight national forecasts show the predicted number of new COVID-19 hospitalizations per day for the next four weeks in the United States.
  • The forecasts make different assumptions about hospitalization rates and levels of social distancing and other interventions and use different methods to estimate the number of new hospitalizations. See models below for details.
State Forecasts

Nine state-level models predicting the number of new hospitalizations were submitted this week. These forecasts show the predicted number of new COVID-19 hospitalizations per day for the next four weeks in each state. Each state forecast uses a different scale, due to differences in the number of new COVID-19 cases occurring per day in each state.

Download state forecasts pdf icon[1 MB, 7 pages]1

Download forecast data excel icon[2 MB]


Additional forecast data and information on forecast submission are available at the COVID-19 Forecasting Hubexternal icon.


Tuesday, October 13, 2020

JAMA: Excess Deaths From COVID-19 and Other Causes, March-July 2020


#15,498

With the caveat that we'll probably be debating the death toll (direct and indirect) from COVID-19  for years (or even decades) to come, we've a new study - published yesterday in JAMA - that attempts to quantify the excess number of deaths in the United States during the opening months of the pandemic.  

While deaths are far from being the only burden from this emerging virus (see PAHO Epi Alert: Complications & Sequelae Of COVID-19), for many people the CFR (Case Fatality Rate) defines the severity of the pandemic. 

Unfortunately, as we've discussed dozens of times in the past (see here, here & here), counting individual deaths due to a specific cause is rarely straightforward.  The CDC's recently published Burden Of The 2019-2020 Flu Season  estimated the number of flu related deaths as 22,000, but that was averaged from a range of 17,970 - 29,053. 


The official count of pediatric flu deaths, which are legally reportable (unlike adult flu deaths), last year was 189.  But the CDC estimates that the true number was probably closer to 600.

Whether you are talking about COVID-19, influenza, or any other infectious disease - it is safe to assume that surveillance and reporting always under-represents the true burden of a disease (see 2018's Why Flu Fatality Numbers Are So Hard To Determine).

In early April, the New York Fire Department reported a 400% increase in sudden cardiac arrest death calls beginning in late March (see NBC affiliate Massive Spike in NYC ‘Cardiac Arrest’ Deaths Seen as Sign of COVID-19 Undercounting).

While most of these cases were never tested for COVID-19, this trend became so pronounced that the city ordered new Standards Of Care During A Pandemic: CPR & Cardiac Arrest, limiting the use of CPR in the field. 

We now know that COVID-19 can cause blot clots and severe cardiovascular damage (see Nature Med. Review: Extrapulmonary manifestations of COVID-19), meaning that some percentage of those cardiac arrests were likely due to the virus.  Most, however, were never tested for the virus. 

While it is impossible to count every COVID-19 related death, we do have an excellent idea of how many people are expected to die over a specific period of time in this country, and following the arrival of COVID-19, those numbers quickly skyrocketed in areas being hard hit by the virus. 

All of which brings us to a new study, published yesterday in JAMA, that compares the expected number of deaths in the United States during the opening months of the pandemic to the actual number of deaths, and finds far more than have been attributed to the virus. 

There is a lot here to absorb, and so we have a link to the study and some excerpts, links to two brief multi-media presentations, two accompanying editorials, and a press release. 

The upshot is that 50% more excess deaths have been reported in the United States since the pandemic began than have been directly attributed to the virus, which suggests the real death toll is substantially higher than has been reported. 


Previous studies of excess deaths (the gap between observed and expected deaths) during the coronavirus disease 2019 (COVID-19) pandemic found that publicly reported COVID-19 deaths underestimated the full death toll, which includes documented and undocumented deaths from the virus and non–COVID-19 deaths caused by disruptions from the pandemic.1,2
A previous analysis found that COVID-19 was cited in only 65% of excess deaths in the first weeks of the pandemic (March-April 2020); deaths from non–COVID-19 causes (eg, Alzheimer disease, diabetes, heart disease) increased sharply in 5 states with the most COVID-19 deaths.1 This study updates through August 1, 2020, the estimate of excess deaths and explores temporal relationships with state reopenings (lifting of coronavirus restrictions).
(SNIP)
Results
Between March 1 and August 1, 2020, 1 336 561 deaths occurred in the US, a 20% increase over expected deaths (1 111 031 [95% CI, 1 110 364 to 1 111 697]). The 10 states with the highest per capita rate of excess deaths were New York, New Jersey, Massachusetts, Louisiana, Arizona, Mississippi, Maryland, Delaware, Rhode Island, and Michigan. The states with the highest per capita rate of excess deaths changed from week to week (Video).
The increase in absolute deaths in these states relative to expected values ranged from 22% in Rhode Island and Michigan to 65% in New York (Table). Three states with the highest death rates (New Jersey, New York, and Massachusetts) accounted for 30% of US excess deaths but had the shortest epidemics (ED90 < 10 weeks). States that experienced acute surges in April (and reopened later) had shorter epidemics that returned to baseline in May, whereas states that reopened earlier experienced more protracted increases in excess deaths that extended into the summer (Figure).

Of the 225 530 excess deaths, 150 541 (67%) were attributed to COVID-19. Joinpoint analyses revealed an increase in deaths attributed to causes other than COVID-19, with 2 reaching statistical significance. US mortality rates for heart disease increased between weeks ending March 21 and April 11 (APC, 5.1 [95% CI, 0.2-10.2]), driven by the spring surge in COVID-19 cases. Mortality rates for Alzheimer disease/dementia increased twice, between weeks ending March 21 and April 11 (APC, 7.3 [95% CI, 2.9-11.8]) and between weeks ending June 6 and July 25 (APC, 1.5 [95% CI, 0.8-2.3]), the latter coinciding with the summer surge in sunbelt states.

         (Continue . . . )
 

You'll the find two accompanying editorials below, followed by a link and excepts from a press release from the Virginia Commonwealth University.

Editorial
October 12, 2020

Excess Deaths and the Great Pandemic of 2020
Howard Bauchner, MD1; Phil B. Fontanarosa, MD, MBA1
Author Affiliations Article Information

JAMA. Published online October 12, 2020. doi:10.1001/jama.2020.20016

Editorial
October 12, 2020

The Toll of COVID-19
Harvey V. Fineberg, MD, PhD1
Author Affiliations Article Information
JAMA. Published online October 12, 2020. doi:10.1001/jama.2020.20019


States that reopened sooner, such as Texas, Arizona and Florida, experienced summer surges, report says.


A map of the U.S. shows the states that have had the highest rates of excess deaths during the week of July 25, 2020. The latest study from a team of researchers at Virginia Commonwealth University found that some states saw a protracted summer surge in the rate of excess deaths, both from COVID-19 and from the effects of the pandemic itself. (Courtesy of JAMA Network)

By Jackie Kruszewski
C. Kenneth and Dianne Wright Center for Clinical and Translational Research
(804) 828-6671
kruszewskij@vcu.edu
Monday, Oct. 12, 2020
For every two deaths attributed to COVID-19 in the U.S., a third American dies as a result of the pandemic, according to new data published in the Journal of the American Medical Association.

The study, led by researchers at Virginia Commonwealth University, shows that deaths between March 1 and Aug. 1 increased 20% compared to previous years — maybe not surprising in a pandemic. But deaths attributed to COVID-19 only accounted for 67% of those deaths.

“Contrary to skeptics who claim that COVID-19 deaths are fake or that the numbers are much smaller than we hear on the news, our research and many other studies on the same subject show quite the opposite,” said lead author Steven Woolf, M.D., director emeritus of VCU’s Center on Society and Health.

The study also contains suggestive evidence that state policies on reopening early in April and May may have fueled the surges experienced in June and July.

“The high death counts in Sun Belt states show us the grave consequences of how some states responded to the pandemic and sound the alarm not to repeat this mistake going forward,” said Woolf, a professor in the Department of Family Medicine and Population Health at the VCU School of Medicine.
Total death counts in the U.S. are remarkably consistent from year to year, as the study notes. The study authors pulled data from the Centers for Disease Control and Prevention for 2014 to 2020, using regression models to predict expected deaths for 2020.
The gap between reported COVID-19 deaths and all unexpected deaths can be partially explained by delays in reporting COVID-19 deaths, miscoding or other data limitations, Woolf said. But the pandemic’s other ripple effects could explain more.
“Some people who never had the virus may have died because of disruptions caused by the pandemic,” said Woolf, VCU’s C. Kenneth and Dianne Wright Distinguished Chair in Population Health and Health Equity. “These include people with acute emergencies, chronic diseases like diabetes that were not properly care for, or emotional crises that led to overdoses or suicides.”
For example, the study specifically showed that the entire nation experienced significant increases in deaths from dementia and heart disease. Woolf said deaths from Alzheimer’s disease and dementia increased not only in March and April, when the pandemic began, but again in June and July when the COVID-19 surge in the Sun Belt occurred.

While COVID-19 qualifies in my mind as being a relatively low mortality - high morbidity pandemic (at least compared to what we've might have seen from MERS-CoV or avian flu), it has likely claimed 10 times more lives in the past 7 months than the moderate 2019-2020 flu season did in 12 months (est. 22,000).  

And since COVID-19 arrived in the spring, we have yet to go through a winter with this pandemic virus.  Full comparisons will have to wait until March or April. 

And the evidence right now suggests we are in for a long, and difficult winter. 

Thursday, July 04, 2024

CDC NCIRD: COVID-19 Can Surge Throughout the year


#18,165

The `conventional wisdom' about pandemics - and in 2020, about COVID - was that a pandemic might last between 12-18 months, during which time the community would (through exposure or vaccines) develop increasing `herd' immunity.   

While not everyone agreed  (see Apr 2020's From Here to Immunity), starting only months into the pandemic, many governments were predicting an early end to the COVID pandemic once a `magic number' of infected was reached (see GAO: A Herd Immunity For COVID-19 Primer). 


There were problems - evident from quite early in the pandemic - to that cheery scenario. First, COVID infection tended to leave behind only temporary immunity.  Some of the studies that emerged in the summer and fall of 2020 included:

CDC Clarifies: Recovered COVID-19 Cases Are Not Necessarily Immune To Reinfection

Kings College: Longitudinal Evaluation & Decline of Antibody Responses in SARS-CoV-2 infection

EID Journal: Antibody Profiles According to Mild or Severe SARS-CoV-2 Infection

Second, while the COVID virus had remained relatively stable during the first year, it began to mutate rapidly starting in 2021. Fast forward to 20 months into the pandemic - after the emergence of both the Alpha & Delta waves - and once again we began to see predictions that  `immunity was just around the corner'

Some headlines from October, 2021 included:

OHSU analysts predict herd immunity impacts by end of year

Hawaii is at the ‘beginning of the end of the pandemic’ with herd immunity on the horizon; Officials warn not to let guard down

Florida could reach herd immunity by Nov. 10

But of course, the emergence of a radically different Omicron variant the following month derailed those hopes, and we saw the biggest wave of the pandemic in the winter of 2022. 

While a `political' decision was made to end the pandemic in 2023 - and greatly reduce surveillance and reporting - the virus is very still with us.  

Despite continued expectations that the virus would attenuate and become another in the panoply of `seasonal respiratory viruses', it continues to produce significant and unpredictable waves throughout the year.


We are now 54 months since the emergence of COVID in late 2019, and we are facing another summer wave of the virus. Yesterday the CDC's NCIRD (National Center for Immunization and Respiratory Diseases) published an overview of the COVID virus, stressing that:

`Because the evolution of new variants remains unpredictable, SARS-CoV-2 is not a typical “winter” respiratory virus.'

They go on to stress the importance of staying current with COVID vaccinations, staying home if sick, and using NPIs.  Some excerpts from their report follow, after which I'll have a brief postscript.

COVID-19 can surge throughout the year

AT A GLANCE

Many respiratory virus illnesses peak during the winter due to environmental conditions and human behaviors. COVID-19 has peaks in the winter and also at other times of the year, including the summer, driven by new variants and decreasing immunity from previous infections and vaccinations. You can protect yourself from serious illness by staying up to date with vaccinations, getting treated if you have medical conditions that make you more likely to get very sick from COVID-19, and using other strategies outlined in CDC's respiratory virus guidance.

Summary

What CDC knows

In the United States, respiratory virus illnesses typically peak during the fall and winter. These peaks are due to several factors, including human behaviors and environmental conditions that can affect the ability of viruses to survive and spread.

Since the start of the COVID-19 pandemic, infections with SARS-CoV-2, the virus that causes COVID-19, have peaked during the winter and also surged at other times of the year. These periodic surges are due in part to the emergence of new variants and decreasing immunity from previous infections and vaccinations. Because the evolution of new variants remains unpredictable, SARS-CoV-2 is not a typical “winter” respiratory virus.

What CDC is doing


CDC continues to monitor seasonal trends of COVID-19 and the factors driving these trends, including the emergence of new variants, and to collaborate with state and local health departments, commercial laboratories, and global partners. On June 27, the Advisory Committee on Immunization Practices (ACIP), an independent advisory group to CDC, recommended that persons ≥6 months of age receive the 2024–2025 COVID-19 vaccines when they become available this fall.
Why do many respiratory viruses spread more in the winter?

Many respiratory viruses have increased circulation during the winter. Factors that drive these seasonal patterns fall into a few broad categories:
  • Environmental conditions: Temperature and humidity can affect the ability of viruses to survive and spread. Dry conditions, which are particularly common in winter, can cause water to evaporate more quickly from respiratory droplets produced by coughing or sneezing, resulting in smaller particles that last longer in the air and travel longer distances. SARS-CoV-2, the virus that causes COVID-19, survives longer in colder temperatures, and increased spread has been associated with lower fall/winter temperatures.
  • Immune susceptibility: Dry and cold air interfere with the ability of the body to sweep viruses out of the upper respiratory tract, which is the first line of the immune system's defense. At the population level, protection from prior infection and vaccination wanes over time. This results in more people being susceptible in the winter when respiratory viruses are spreading the most.
Behavioral patterns: Spending more time indoors with less ventilation during the colder months, as well as holiday gatherings and travel, can increase spread. That's because viruses spread between people more easily indoors than outdoors in part because the concentration of these particles is often higher indoors. Similar conditions can also happen in summer when people spend more time indoors, keep windows closed while using air conditioning, and travel for summer vacations.

COVID-19 seasonality
COVID-19 activity tends to fluctuate with the seasons, meaning it has some seasonal patterns. Data from four years of COVID-19 cases, hospitalizations, and deaths show that COVID-19 has winter peaks (most recently in late December 2023 and early January 2024), but also summer peaks (most recently in July and August of 2023).
There is no distinct COVID-19 season like there is for influenza (flu) and respiratory syncytial virus (RSV). While flu and RSV have a generally defined fall/winter seasonality and circulate at low levels in most parts of the United States in the summer, meaningful COVID-19 activity occurs at other times of the year.

Understanding when COVID-19 tends to peak helps to better tailor public health prevention strategies and recommendations, prepare our healthcare system, and allocate resources. That's especially important because the winter peak tends to overlap with those for flu, RSV, and many other viruses. Getting an updated COVID-19 vaccine in the fall can help better protect you through the winter peak. People who might benefit from additional doses of COVID-19 vaccine this summer include those who are:
  • 65 years of age and older,
  • Moderately or severely immunocompromised or with underlying medical conditions,
  • Living in long-term care facilities,
  • Of any age and have never received COVID-19 vaccine, and
  • Pregnant, especially in late pregnancy.
CDC's Advisory Committee on Immunization Practices (ACIP) met on June 27 and recommended that persons ≥6 months of age receive the 2024–2025 COVID-19 vaccines when they become available this fall. The U.S. Foospringd and Drug Administration recently selected strains for the vaccine based on currently circulating variants.
New variants affect patterns of COVID-19 activity

The emergence of new SARS-CoV-2 variants has been associated with COVID-19 surges, including an increase in the magnitude of winter peaks and additional peaks at other times of the year. Peaks in COVID-19 activity often, but not exclusively, occur in winter (blue bar in chart, below) and in summer (pink bar in chart). New variants, such as Delta and Omicron, contributed to several peaks.

Although the future pace of SARS-CoV-2 evolution is unpredictable, surges outside the winter season will likely continue as long as new variants emerge and immunity from previous infections and vaccinations decreases over time.

CDC continues to track the emergence of new variants through genomic sequencing, in collaboration with state and local health departments, commercial laboratories, and global partners. CDC also continues to monitor trends in COVID-19 to inform vaccine recommendations, and to publish weekly data so that the public can make informed decisions regarding their individual risk throughout the year.

          (Continue . . . )

 
During the spring, with COVID activity waning, I discontinued my routine of wearing a KN95 mask when in crowded indoor conditions, but over the past month I've resumed the practice.  I go through a fair amount of alcohol hand sanitizer, and I'll be getting both updated flu and COVID shots in the fall. 

While COVID infection isn't as deadly as it once was, it still claims thousands of lives every month, and we continue to see studies that validate early concerns over the damage from `Long COVID' (see CIDRAP New definition of long COVID aims to offer clarity, direction).

All of which makes me believe the extra effort required to protect myself against COVID is still worth doing. 

Sunday, March 29, 2020

CDC Issues COVID-19 Domestic Travel Advisory For NY, NJ & CT


#15,151


Although domestic travel advisories within the United States are rare, they are not unprecedented, as we saw limited traveler's advice issued for visiting South Florida during their 2016 Zika outbreak.
In the case of last night's travel advisory, however, the CDC is asking people in the three heavily COVID-19 affected states to avoid non-essential travel from the region, in an attempt to slow the transmission of the virus to other parts of the country. 
At this point, this advisory is simply travel advice, and ignoring it carries no penalties or force of law.  It is not a quarantine. The three affected states would have `. . . have full discretion to implement this Domestic Travel Advisory', although it isn't clear what they could reasonably do to reduce travel.

Beyond the brief travel advisory, the CDC also issued some generic advice on deciding to travel domestically during this COVID-19 pandemic.

Coronavirus and Travel in the United States

CDC Issues Domestic Travel Advisory for New York, New Jersey, and Connecticut
The CDC urges residents of New York, New Jersey, and Connecticut to refrain from non-essential domestic travel for 14 days effective immediately. This Domestic Travel Advisory does not apply to employees of critical infrastructure industries, including but not limited to trucking, public health professionals, financial services, and food supply. These employees of critical infrastructure, as defined by the Department of Homeland Security (https://www.cisa.gov/publication/guidance-essential-critical-infrastructure-workforce ) have a special responsibility to maintain normal work schedule. The Governors of New York, New Jersey, and Connecticut will have full discretion to implement this Domestic Travel Advisory.                                     
Should I travel within the US? 
CDC does not generally issue advisories or restrictions for travel within the United States. However, cases of coronavirus disease (COVID-19) have been reported in many states, and some areas are experiencing community spread of the disease. Crowded travel settings, like airports, may increase chances of getting COVID-19, if there are other travelers with coronavirus infection. There are several things you should consider when deciding whether it is safe for you to travel. 
Things to consider before travel:
  • Is COVID-19 spreading in the area where you’re going?
If COVID-19 is spreading at your destination, but not where you live, you may be more likely to get infected if you travel there than if you stay home. If you have questions about your destination, you should check your destination’s local health department website for more information.
  • Will you or your travel companion(s) be in close contact with others during your trip?
Your risk of exposure to respiratory viruses like coronavirus may increase in crowded settings, particularly closed-in settings with little air circulation. This may include settings such as conferences, public events (like concerts and sporting events), religious gatherings, public spaces (like movie theatres and shopping malls), and public transportation (like buses, metro, trains).
  • Are you or your travel companion(s) more likely to get severe illness if you get COVID-19?
People at higher risk for severe disease are older adults and people of any age with serious chronic medical conditions (such as heart disease, lung disease, or diabetes). CDC recommends that travelers at higher risk for COVID-19 complications avoid all cruise travel and nonessential air travel.
  • Do you have a plan for taking time off from work or school, in case you are told to stay home for 14 days for self-monitoring or if you get sick with COVID-19?
If you have close contact with someone with COVID-19 during travel, you may be asked to stay home to self-monitor and avoid contact with others for up to 14 days after travel. If you become sick with COVID-19, you may be unable to go to work or school until you’re considered noninfectious.
You will be asked to avoid contact with others (including being in public places) during this period of infectiousness. 
  • Do you live with someone who is older or has a serious, chronic medical condition?
If you get sick with COVID-19 upon your return from travel, your household contacts may be at risk of infection. Household contacts who are older adults or persons of any age with severe chronic medical conditions are at higher risk for severe illness from COVID-19.
  • Is COVID-19 spreading where I live when I return from travel?
Consider the risk of passing COVID-19 to others during travel, particularly if you will be in close contact with people who are older adults or have severe chronic health condition These people are at higher risk of getting very sick. If your symptoms are mild or you don’t have a fever, you may not realize you are infectious.
Depending on your unique circumstances, you may choose to delay or cancel your plans. If you do decide to travel, be sure to take steps to help prevent getting and spreading COVID-19 and other respiratory diseases during travel. For the most up-to-date COVID-19 travel information, visit CDC COVID-19 Travel page.

Sunday, June 21, 2020

As COVID-19 Cases Rise Florida's DOH Releases An Additional Public Health Advisory

Florida 30 Day Case Count Reports - FL DOH


#15,335


Florida re-opened following our abbreviated lockdown on Memorial Day Weekend, which was just shy of a month ago. At the time, daily covid-19 case reports ranged from just under 500 to nearly a 1000, and the trend appeared relatively flat.
It was fully expected that COVID-19 cases would rise once the full lockdown was lifted, and so people were encouraged to continue social distancing, hand hygiene, and wearing masks or face covers. 
But it is HOT and muggy in Florida in June, and - as I've mentioned several times over the past couple of weeks - I've been seeing fewer and fewer people wearing masks in public. Since Memorial day, each week we've seen the number of new cases rise, with the most dramatic leaps in the past 10 days (see chart at the top of blog).
Yesterday, Florida recorded a record 4,049 cases. An 8-fold increase over what was reported on Memorial day, 2020 (n=503), just 27 days ago.  
With Florida cases likely to breach 100,000 either today or tomorrow, yesterday the Florida Department of Health released a new health advisory, encouraging vulnerable populations to avoid crowds and to limit interactions outside of their homes.

I'll have a brief postscript after the break:
Florida Department of Health Issues Additional Public Health Advisory
June 20, 2020
Contact: Joint Information Center on COVID-19 for the State of Florida (850) 815-4940, ESF14@em.myflorida.com

Florida Department of Health Issues Additional Public Health Advisory

~Advises wearing masks in public, encourages elderly and vulnerable populations to limit interactions outside of the home, and urges all individuals to refrain from participating in gatherings of more than 50 people~

TALLAHASSEE, Fla. — Today, the Florida Department of Health (Department) issued an additional Public Health Advisory in response to COVID-19, providing recommendations to protect Floridians and visitors from this virus. This advisory is in addition to steps that the Department has taken to increase mitigation measures, including the purchase of 20 million cloth masks, which are actively being distributed statewide. Today, Governor DeSantis also directed the Florida Department of Business and Professional Regulation to increase inspections to ensure that businesses are adhering to applicable Phase 1 and Phase 2 guidance.

The Public Health Advisory provides the following recommendations:

  • All individuals in Florida should wear masks in any setting where social distancing is not possible, unless any of the following apply:
  • A child is under two years of age;
  • An individual has one or more medical conditions or disabilities that prevent wearing a face covering;
  • An individual is obtaining a service involving the nose or face for which temporary removal of the face covering is necessary to perform the service;
  • An individual works in a profession where use of a face covering will not be compatible with the duties of the profession; or
  • An individual is engaged in outdoor work or recreation with appropriate social distancing in place.
  • All individuals over the age of 65 and all individuals of any age with high-risk health conditions should limit personal interactions outside of the home and take all measures to limit the risk of exposure to COVID-19.
  • All individuals should refrain from participation in social or recreational gatherings of more than 50 people. For all gatherings of fewer than 50 people, individuals should practice social distancing by maintaining a distance of at least six feet from each other and wearing a face covering.
This is a reinforcement of the previously issued advisory as well as direction that has been provided in the task force report for a Safe. Smart. Step-by-Step. Plan for Florida’s Recovery.

Currently, 64 counties are in Phase 2, which dictates:

Restaurants, bars and other vendors licensed to sell alcoholic beverages, excluding nightclubs:

  • May operate at fifty percent of the establishment’s indoor capacity.
  • May operate at full capacity outside with appropriate social distancing.
  • Bar areas may operate with seated service.
Entertainment businesses, including but not limited to movie theaters, concert houses, auditoriums, playhouses, bowling alleys and arcades:
  • May operate at fifty percent of the establishment’s capacity with appropriate social distancing between groups and proper sanitization protocols.
In-store retail businesses:
  • May operate at full capacity with appropriate social distancing measures and proper sanitization protocols.
Gyms and fitness centers:
  • May operate at full capacity with appropriate social distancing and frequent sanitization.
Personal services including but not limited to tattooing, body piercing, tanning and massage:
  • May operate while adhering to appropriate safety guidelines outlined by the Florida Department of Health.
Barber shops, hair salons and nail salons:
  • May continue to operate while adhering to safety protocols.
Phase 2 continued emphasis on preventative measures outlined by the CDC and OSHA:
Senior citizens and individuals with a significant underlying medical condition are strongly encouraged to avoid crowds and take measures to limit the risk of exposure to COVID-19.

  • Individuals should avoid gathering in groups larger than 50.
  • All persons who work in long-term care facilities should be tested for COVID-19 on a routine basis.
The three counties with the highest number of cases (Palm Beach, Broward and Miami-Dade counties) are still in Phase 1, which dictates:

Restaurants and food establishments:

  • May operate at fifty percent capacity with proper social distancing.
  • Outdoor seating is encouraged.
Retail establishments:
  • May operate at up to fifty percent capacity indoors with appropriate social distancing measures and proper sanitization protocols.
Museums and libraries:
  • May operate at up to fifty percent capacity if permitted by local governments.
Gyms and fitness centers:
  • May operate at up to fifty percent capacity with appropriate social distancing and sufficient sanitization measures.
Barber shops, hair salons, and nail salons:
  • May operate while adhering to safety protocols.
About the Florida Department of Health
The Florida Department of Health, nationally accredited by the Public Health Accreditation Board, works to protect, promote and improve the health of all people in Florida through integrated state, county and community efforts.

Follow us on Facebook, Instagram and Twitter at @HealthyFla. For more information please visit www.FloridaHealth.gov.
https://content.govdelivery.com/accounts/FLDEM/bulletins/291d448

 
Since I'm squarely situated in the `vulnerable' cohort (over 65 with comorbidities), I'm adhering to the social distancing and NPI (Non-pharmaceutical Intervention) recommendations as best as I can.
Sadly, I was at my doctor's office on Friday, and only half of the people in the waiting room were wearing masks.  Thankfully, the only one who was coughing put on a mask after receiving several angry looks from waiting patients. 
While I fully accept the need to re-open the economy, and share the same level of `COVID-fatigue'  as everyone else - if we abandon NPIs - we will only exacerbate an already bad situation, and likely prolong our collective misery at the same time.

Masks and face covers may not provide perfect protection, but the evidence increasingly supports their use.
Two Studies (The Lancet & EID Journal) On The Impact Of NPIs On COVID-19 Spread

HKU: The Surgical Mask (Hamster) Study
EID Journal (Letter): On The Wearing Of Face Masks In Public

Friday, September 15, 2023

CDC 2023-2024 Respiratory Disease Season Outlook


#17,675

Although influenza is frequently said to be `unpredictable', about 10 years ago the CDC began to investigate ways to anticipate its near-term moves (see CDC Competition Encourages Use of Social Media to Predict Flu), and since then the CDC's Influenza Division has collaborated with external researchers on flu forecasting.

Over time, and particularly since the start of the COVID pandemic, respiratory disease forecasting has evolved, with the Center for Forecasting and Outbreak Analytics (CFA) established in 2021, and officially launched in the spring of 2022.

Of course, there are always a lot of unknowns, and forecasting - while it is improving - remains in its infancy. Surprises are always possible.  The CDC describes the difficulties:

Influenza (flu) places a significant disease burden on the U.S. population, but the magnitude and timing of flu activity varies from season to season, making the annual impact of flu uncertain at the beginning of each season. Flu forecasting can help decrease that uncertainty by predicting in advance when and where increases in flu activity will occur. Unlike CDC’s traditional influenza surveillance systems, which measure flu activity while it is occurring, flu forecasting offers the possibility of looking into the future and better planning ahead for changes, such as increases in flu-related hospitalizations.

         (SNIP)

How can flu forecasts be used?

Flu forecasts can be used to prepare for changes in flu activity, such as increases in hospitalizations. When forecasts accurately predict flu activity, more effective planning of public health responses to seasonal flu epidemics and future flu pandemics is possible. Flu forecasts can inform messaging to health care providers regarding:
  • antiviral treatment allocation,
  • preparation for an influx of flu-related hospitalizations,
  • informing the distribution and placement of health care staff, hospital beds and treatment resources.
Flu forecasts can also be used to help guide personal and community mitigation strategies. These can include non-pharmaceutical interventions, such as reducing contact during times of forecasted high flu activity, as well as conveying the importance of flu vaccination prior to forecasted increases in flu activity.

Yesterday, the CDC's CFA and NCIRD released a preliminary respiratory disease season `outlook' that presents a range of potential scenarios for this fall and winter.  Basically, they anticipate a similar number of hospitalizations to what we saw last winter.

There are - as they point out - a lot of unknowns, including the future impact of BA.2.86.  

As a result, they currently only have low-to-moderate confidence in this early assessment. I'll have a brief postscript after the break.

Respiratory Disease Season Outlook

Outlook

CDC expects the upcoming fall and winter respiratory disease season will likely have a similar number of total hospitalizations compared to last year. As with last year, the number of hospitalizations is expected to be higher than that experienced prior to the COVID-19 pandemic, when severe disease was caused primarily by the influenza virus and the respiratory syncytial virus (RSV).

However, it remains possible that hospitalizations this season may be higher than last year, with more widespread illness and healthcare system strain. This increase could result from the emergence of a new COVID-19 variant with an increased ability to evade the body’s prior immunity, or from a severe influenza season combined with COVID-19 and RSV waves that are similar to last year, or, as we saw last year, an increase in RSV infections. A key factor is the timing of the peak number of hospitalizations associated with each disease and whether those peaks coincide.

This outlook is based on expert judgment, historical data, and scenario modeling for COVID-19. We have low to moderate confidence in this assessment because of uncertainties in anticipating the timing of when diseases will peak and levels of disease.

Vaccination remains the best way to protect yourself and your loved ones against serious outcomes of these diseases. Vaccination is especially important for people who are at higher risk of developing serious complications.

CDC is offering this outlook to provide decision-makers information to assist with public health preparedness planning, including potential surges in hospital demand.


What is the rationale for this outlook for each disease?

Infectious disease experts and scenario models provide evidence that this season is likely to bring a moderate COVID-19 wave, causing around as many hospitalizations at the peak as occurred at last winter’s peak.
  • There is widespread, population-level protective immunity to COVID-19 from prior infections and/or vaccinations, making it unlikely that COVID-19 will cause very large waves of severe disease or hospitalization, according to modeling by the COVID-19 Scenario Modeling Hub.
  • COVID-19 could peak earlier than last season, however, because of limited summer activity compared to past years.
Experts anticipate that the influenza season will fall in the typical range of severity. However, even typical seasons vary widely in the number of illnesses, hospitalizations, and deaths. 
  • Experts do not believe that the COVID-19 pandemic—and associated interventions and behavior changes—will continue to have a major impact on influenza transmission, following reduced influenza activity in 2020-2021 and an early peak for the 2022-2023 season.
Experts anticipate that RSV is likely to return to normal season patterns following a severe season last year.
  • Last year’s season likely elevated population immunity to typical levels, which had previously been lower because of reduced RSV circulation early in the COVID-19 pandemic.
  • There are also new RSV prevention tools available, which could potentially decrease hospital burden. These include vaccines for those aged 60 years and older and an immunization for infants.

What are the key uncertainties?

High immunization uptake could reduce the number of hospitalizations substantially. i,ii,iii,iv It is difficult to predict the size and timing of peak activity for each disease, as well as how the timing might overlap. These factors will affect the level of strain on the healthcare system. There is also considerable uncertainty about the level of vaccine uptake, particularly for the RSV vaccine for older adults and RSV immunization for infants that are new this season.

The COVID-19 pandemic changed patterns for influenza and RSV circulation, and there could be lingering effects on population immunity or behavior that continue to affect influenza or RSV levels this season.
Other disease-specific uncertainties include the following: 
  • The virus that causes COVID-19 is constantly changing, and a new variant could emerge which is less effectively mitigated by immunity from past infections or from existing vaccines and treatments. COVID-19 has not yet occurred as a regular seasonal disease, so we do not yet fully understand how the timing and magnitude of waves will vary.
  • We do not yet know which influenza viruses will predominate, which can affect the number of severe illnesses and hospitalizations. We also do not yet know how effective vaccines will be against the predominant viruses.
  • Particularly for RSV, we have less precise estimates for the burden of illnesses and hospitalizations data on past seasons to inform expectations for this fall/winter.

What are some potential scenarios for the peak hospital demand during the upcoming season?

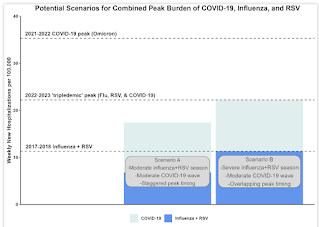
CDC developed two hypothetical scenarios for the peak hospital burden of COVID-19, influenza, and RSV. These scenarios illustrate how the additional burden from COVID-19 during a moderate season for the three respiratory diseases may generate more hospital demand – potentially resulting in hospital strain – than a severe influenza and RSV season prior to the emergence of COVID-19 (Figure 1).


The graph above shows that a moderate influenza and RSV season with a moderate COVID-19 wave (the combined bar on the left) could generate more hospital strain than a severe, pre-COVID-19 influenza and RSV season (the dark blue bar on the right). While we cannot predict the precise timing and impact of these three pathogens each season, these are two plausible scenarios.
  • In scenario A, we combine a moderate past season peak for influenza and RSV equal to 2019-20 with a moderate COVID-19 wave equal to winter 2022-23. We also shift the timing of the COVID-19 wave so that the peak occurs three weeks prior to the peak of influenza + RSV hospitalizations. In this scenario, the peak hospitalization rate is roughly 20% lower than the 2022-2023 peak. The peak is higher than the level for a severe season of influenza and RSV combined, as illustrated by Scenario B.
  • In scenario B, we combine a severe past season peak for influenza and RSV equal to 2017-18 with a moderate COVID-19 wave equal to winter 2022-23. We also shift the timing of the COVID-19 wave so that its peak occurs in the same week as influenza + RSV peak hospitalizations. In this scenario, the peak hospitalization rate is similar to that of the 2022-2023 season and slightly higher than the peak hospitalization rate for COVID-19 alone in the 2020-2021 season.

How does the emergence of new COVID-19 variants such as BA.2.86 affect this outlook?

At this time, we do not know enough about BA.2.86 to assess its potential impact on the upcoming disease season, though the scenarios outlined here likely account for the emergence of a wide range of variants.

CDC is continually monitoring for new variants and studying their potential impact on public health. Scientists are evaluating the effectiveness of the updated COVID-19 vaccine.

CDC’s current assessment is that this updated vaccine will be effective at reducing severe disease and hospitalization. At this point, there is no evidence that this variant is causing more severe illness. That assessment may change as additional scientific data are collected.

We are monitoring carefully and will update this outlook as we learn more.


How will CDC monitor respiratory illnesses this season?
CDC has a robust system of domestic and global monitoring and early warning systems, which include tracking data on hospitalizations, emergency department visits, laboratory tests, genomic sequencing, and wastewater testing.
CDC is also working to improve real-time analysis and forecasting for these diseases. CDC produces regular influenza forecasts throughout the season. For COVID-19, we are producing regular forecasts and working to improve these predictions through integrating past data on COVID-19 activity to understand seasonal variation in epidemic timing and magnitude.

CDC will update this outlook as we learn more about respiratory virus activity this season.

This outlook was prepared by CDC’s Center for Forecasting and Outbreak Analytics (CFA) and National Center for Immunization and Respiratory Diseases (NCIRD). 


Since I'm pushing 70, I remember the day weather forecasting changed forever; April 1st 1960. The day that TIROS I - the world's first weather satellite - was launched into Earth orbit from Cape Canaveral, Florida.

TIROS 1 could take and transmit about 1 picture an hour, but only during daylight hours (infrared capability was added to later `birds'). And while the pictures were grainy, and the resolution laughable by today's standards, for the first time we could watch from space and see how and where hurricanes formed.

It meant we were no longer solely dependent on ship's reports and Hurricane Hunter aircraft to know if disaster was creeping just beyond the horizon. It meant coastal residents could count on more than 12 hours warning to prepare for a storm.

Sixty years later, hurricanes can still sometimes fool us (e.g. Ian, Dorian, etc.), but we are far more confident in their forecast paths than we were even a decade or two ago

Over time, I expect the accuracy of influenza/COVID/RSV forecasting to make similar gains.  Today's  confidence levels will improve, although the potential for a nasty surprise will probably always be with us.

As far as this outlook is concerned, a lot will depend upon the uptake of influenza, COVID, and RSV vaccines in the months ahead.  

And that may be harder to predict than what theses viruses will do.