Monday, September 07, 2026

Pathogen's Progress

H5 Affected States & Provinces June 2015


#19,326

Prior to 2021, North America had only had one brush with the Asian-origin HPAI H5 virus; a reassorted H5N8 subtype which appeared in South Korea in January of 2014 before beginning a world tour. 

It crossed the north Pacific - carried by migratory birds - the following fall, arriving in the Pacific Northwest in December 2014, sparking the first HPAI H5 epizootic in the United States and Canada (see map above).

That H5Nx virus, however, disappeared completely the following summer, apparently still ill-suited for long-term carriage by wild and migratory birds (see PNAS: The Enigma Of Disappearing HPAI H5 In North American Migratory Waterfowl).

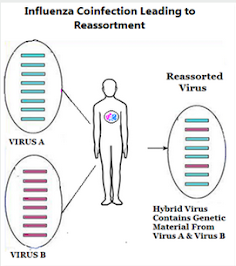
That limitation would evaporate in the summer of 2016 when H5N8 reassorted into a far more robust threat (probably in China or Siberia) - arriving in Europe in October - and sparking their biggest (at that time) epizootic on record. EID Journal: Reassorted HPAI H5N8 Clade 2.3.4.4. - Germany 2016)

This new H5N8 was not only deadlier to some bird species, it was more easily carried by others, increasing its range and impact dramatically over the next 6 months.  
We also saw this virus spin off several short-lived subtypes, including H5N5, H5N3, and H5N9. 
Over the winter of 2016-17, this H5N8 virus spread from Europe, into the Middle East, and then North Africa. By late spring, 2017, it had crossed the equator for the first time,  and set up shop in South Africa, making it the most successfully disseminated HPAI H5 virus we'd seen.
A European H5N6 briefly appeared in 2018, but H5N8 held on until a new, reassorted H5N1 virus appeared in Europe in 2020, and began to supplant H5N8. 

Unlike previous H5Nx incarnations, this new H5N1 showed an increased affinity for infecting mammals, and a much wider avian host range (see DEFRA: The Unprecedented `Order Shift' In Wild Bird H5N1 Positives In Europe & The UK).

By 2022 this `new and improved' H5N1 virus had crossed both the Atlantic and Pacific oceans, spreading first to North America, followed by South America, the Antarctic, and most recently (2026) into Australia/New Zealand.   

While avian flu activity still decreased during the hotter months, no longer did HPAI H5 disappear completely each summer. It could be maintained (at low levels) in local birds, livestock, small mammals, and likely even the environment. 

All of which makes the HPAI H5 threat of today far different from what it was even a decade ago. The H5N1 virus of today has expanded not only its geographic range, but its host range as well.  

And it isn't done evolving. 

Since its arrival in 2021, the H5Nx virus has diversified into more than 100 distinct genotypes in North America alone, with scores of others emerging around the globe.  A few notable North American examples include:

These variants illustrate just how quickly (and dramatically) the avian `fluscape' can change, and we generally see those changes in the fall, when migratory birds - which spent their summers in their high latitude roosting areas - return. 

A 2016 study (see Sci Repts.: Southward Autumn Migration Of Waterfowl Facilitates Transmission Of HPAI H5N1), suggests that waterfowl pick up new HPAI viruses in the spring (likely from poultry or terrestrial birds) on their northbound trip to their summer breeding spots - where they spread and potentially evolve - and then redistribute them on their southbound journey the following fall.

Our own Arctic Refuge, where more than 200 bird species spend their summers, serves as a central hub, and funnels migratory birds south via all four North American Flyways.

While this fall's HPAI viruses could be similar to what we saw last year - they might include new, potentially game-changing, genotypes - which could either increase or decrease their threat.

Evolution is a double-edged sword, and what it adds it can also take away. But the trajectory of H5N1 over the past 4+ years has been towards more mammalian adaptation, and increased host range.  

The APPA estimates `Eleven (11) million U.S. households own backyard chickens (a 28% increase from 2023)', yet a recent survey (see MMWR: Knowledge, Attitudes, and Practices Regarding Avian Influenza Among Owners of Backyard Flocks) found significant gaps in their knowledge of dealing with avian flu.

While no one can predict with any confidence what HPAI will look like later this fall, the one thing we can be sure of is the 2026 fall southbound migration has already begun, and the time to prepare for its arrival grows shorter with every passing day. 

And if recent history is any guide, we should be preparing for additional surprises. 

Sunday, September 06, 2026

CDC Update: Flu Levels Remain Low, But COVID Increasing Across the U.S.

 
          Last Week                               This Week

#19,325

Last week, after a summer of low COVID activity reported in the United States, we looked at Low But Increasing COVID reports across the nation.  At that time, wastewater testing in 8 states indicated increased activity, while this week (see graphic above) the number of states has risen to 11

At the same time, the percentage of positive tests for COVID has jumped from 5.3 last week to 6.2 this week. Still low, but edging higher. 


The CDC's weekly summary reads:


Testing, and reporting, of COVID cases remain low, and so the CDC's Nowcast is unable provide us with much in the way of details on this summer's variants.


Last month the FDA approved a new JN.1 lineage XFG subvariant COVID vaccine (see CIDRAP FDA approves new COVID vaccines) which should be available later this fall.

Currently, influenza and RSV are reportedly at very low levels (see chart below), but with fall approaching, those numbers are expected to rise in the months ahead. 


As reported a little over a week ago (see Japan MHLW Reports Unusually Early Start to the Fall Flu Season) a few countries in the Northern Hemisphere are already reporting substantial flu, even as the virus continues in the Southern Hemisphere. 

Admittedly, every flu season is different, and it is not unusual to see vastly different flu seasons in different parts of the world. So flu's early arrival in Japan may not be a harbinger for North America or Europe.

This year's fall flu vaccines have been updated to reflect recent antigenic changes observed in all 3 seasonal flu types (see WHO Recommendations for Influenza Vaccine Composition for the 2026-2027 Northern Hemisphere Influenza Season).

While no flu vaccine can promise 100% protection, it – along with practicing good flu hygiene (washing hands, wearing face masks in crowded indoor spaces, covering coughs, & staying home if sick) – remains your best strategy for avoiding the flu and staying healthy this winter.

For some more reasons to consider getting the flu vaccine, you may wish to revisit:

Eurosurveillance: Influenza Vaccination Attenuates Acute Myocardial Infarction and Stroke Risk Following Influenza Infection

Nature: Influenza Vaccination & Major Cardiovascular Risk: a Systematic Review & Meta-Analysis

The Lancet: Influenza Vaccine to Reduce Adverse Vascular Events in Patients with Heart Failure

AHA: Study Shows Flu Shots Reduce Deaths From Heart Failure

Saturday, September 05, 2026

#NPM26: Preparing For An El Niño Winter

Credit NOAA

Note: This is the 5th day of National Preparedness Month. Follow this year’s campaign on Twitter by searching for the #NatlPrep #BeReady or #PrepMonth hashtags.

This month, as part of NPM26, I’ll be rerunning some updated preparedness essays, along with some new ones.

#19,324

Two years ago I was forced to evacuate (for the 3rd time in 10 years) from my west-central Florida home due to the approach of hurricane Milton, which passed 50-60 miles to my south. 

While I live roughly 40 miles inland, and at a high (for Florida) elevation, we saw prolonged hurricane force winds, massive tree damage, and - thanks to 14" of rain in a few hours - a 500 year-flood.

It took 4 days for the water to recede enough for me to return home. Luckily I had a `disaster buddy' who took me and my cat in for the duration. I was lucky, my home wasn't flooded, although some only a hundred yards away were. 

It took 4 days to get power back on, and a week to get internet (see Signs of Life).  While my home took substantial wind damage, it was inland flooding that caused the worst damage to my community. 

Now, imagine that sort of rain dump happening - perhaps repeatedly - this winter in California.  That's the growing concern for state officials (see ABC-7 News  'Super El Niño' strengthens, triggering preparations for possible flooding in LA County).

Depending on the intensity, duration, and frequency of such storms, it could even lead to an ARkStorm event, which we first looked at 15 years ago in ARkStorm: California’s other "Big One".

While it sounds like the plot from a bad made-for-cable Sci Fi film, this actually comes from the USGS Multi Hazards Demonstration Project (MHDP) analysis of a winter storm scenario with historical precedence.

From the USGS website

Experts have designed a large, scientifically realistic meteorological event followed by an examination of the secondary hazards (for example, landslides and flooding), physical damages to the built environment, and social and economic consequences. The hypothetical storm depicted here would strike the U.S. West Coast and be similar to the intense California winter storms of 1861 and 1862 that left the central valley of California impassible. The storm is estimated to produce precipitation that in many places exceeds levels only experienced on average once every 500 to 1,000 years.

We returned to this topic in 2022's California's ARkStorm Scenario Revisited, after the USGS released an updated assessment; one that suggested that as the climate grows hotter and dryer, it increases the odds of seeing another catastrophic ARkStorm event. 

Climate change is increasing the risk of a California megaflood
XINGYING HUANG AND DANIEL L. SWAIN 
SCIENCE ADVANCES
12 Aug 2022
Vol 8, Issue 32
DOI: 10.1126/sciadv.abq0995

Abstract

Despite the recent prevalence of severe drought, California faces a broadly underappreciated risk of severe floods. Here, we investigate the physical characteristics of “plausible worst case scenario” extreme storm sequences capable of giving rise to “megaflood” conditions using a combination of climate model data and high-resolution weather modeling.

Using the data from the Community Earth System Model Large Ensemble, we find that climate change has already doubled the likelihood of an event capable of producing catastrophic flooding, but larger future increases are likely due to continued warming. We further find that runoff in the future extreme storm scenario is 200 to 400% greater than historical values in the Sierra Nevada because of increased precipitation rates and decreased snow fraction. These findings have direct implications for flood and emergency management, as well as broader implications for hazard mitigation and climate adaptation activities.

       (Continue . . . )

This is an extreme scenario - and remains a low probability event despite this winter's El Niño - but even something less severe could cause considerable damage, and potentially loss of life. 

So, the question is, how ready are you and your family for severe weather this winter?  The LA County website  advises:

LA County is preparing its flood control and emergency response systems now. Crews are inspecting and maintaining dams, debris basins, channels, storm drains, and pump stations; monitoring burn areas, hillsides, and other areas at risk of flooding and debris flows; and preparing for evacuations, emergency shelter, and other storm response. County teams are also preparing to assist people experiencing homelessness, older adults, and others who may need additional help during severe weather.

Here’s what residents can do now:
  • Sign up for emergency alerts: Go to alert.lacounty.gov to receive emergency notifications, including evacuation warnings and orders.
  • Know the risks where you live: If you are near a hillside, canyon, recent burn area, or area that can flood, learn your flood and mudflow risk before a storm.
  • Make an evacuation plan: Know where you will go and how you will get there if you need to leave quickly.
  • Have supplies ready: Keep enough food, water, medications, and other essentials for up to 10 days.
  • Prepare your home: Clear gutters, downspouts, and storm drains, fix roof leaks, and get sandbags before heavy rain is in the forecast.
  • Consider flood insurance: Standard homeowners insurance does not cover flood damage. Flood insurance is separate and can take at least 30 days to go into effect.
  • Need help with mud or debris flow risk? Call LA County Public Works at 1-800-933-0930 to speak with an engineer.
  • Know someone experiencing homelessness who needs help? Visit homeless.lacounty.gov/get-help/

But it isn't just California that could be impacted by a strong El Niño.  

Here in Florida - where we are enjoying the quietest Atlantic Hurricane Season in recent memory - we've a history of seeing strong winter storms during El Niño years, including the tornado outbreak of 1998 which killed 42 people. 

Predicting exactly where unusual or severe weather will occur this winter due to El Niño is impossible, but generally, the jet stream across the United States shifts storm tracks to the southern tier of states. 


While this doesn't guarantee that other areas will get a free ride this winter, it does suggest that California may be unusually wet, and ice storms and blizzards may be more likely to develop across the deep south this coming winter. 

Exactly where that may happen is unknowable, but five years ago (Feb 2021) 3 successive winter storms swept across Texas, Louisiana, and Oklahoma, causing the worst collapse of the Texas energy grid on record (see Texas: The Latest - But Not The Last - Grid Down Crisis).

At least 4.5 million homes were without power during a week of bitter winter temperatures, resulting in hundreds of deaths and tens of billions of dollars of damage (see City of Austin & Travis County 2021 WINTER STORM URI AFTER-ACTION REVIEW).


While I can't tell you where the next natural disaster will strike, or how bad it will be, being prepared for whatever comes is your best defense. 

So, if the grid goes down, or flood waters rise, or the ground begins to shake . . . do you already have?
  • A battery operated NWS Emergency Radio to find out what was going on, and to get vital instructions from emergency officials
  • A decent first-aid kit, so that you can treat injuries
  • Enough non-perishable food and water on hand to feed and hydrate your family (including pets) for the duration
  • A way to provide light when the grid is down.
  • A way to cook safely without electricity
  • A way to purify or filter water
  • A way to handle basic sanitation and waste disposal.
  • A way to stay cool (fans) or warm when the power is out.
  • A small supply of cash to use in case credit/debit machines are not working
  • An emergency plan, including meeting places, emergency out-of-state contact numbers, a disaster buddy, and in case you must evacuate, a bug-out bag
  • Spare supply of essential prescription medicines that you or your family may need
  • A way to entertain yourself, or your kids, during a prolonged blackout
If not, you've got some important work to do.  A good place to get started is by visiting Ready.gov.

Friday, September 04, 2026

#NatlPrep: 75% of Americans At Risk Of Experiencing A Damaging Earthquake


Note: This is the 4th day of National Preparedness Month. Follow this year’s campaign on Twitter by searching for the #NatlPrep #BeReady or #PrepMonth hashtags.

This month, as part of NPM26, I’ll be rerunning some updated preparedness essays, along with some new ones.

#19,323

Over the past 3 months, in addition to hundreds of mild-to-moderate earthquakes, the world has seen 3 devastating seismic events:
  • In early June, the Philippines was struck by a 7.8 quake offshore of Mindanao, killing more than 100 people, and damaging more than 100 thousand homes.
  • Two weeks later Venezuela was struck by twin quakes (7.2 and 7.5) - 39 seconds apart - killing more than 6500 people, and destroying tens of thousands of buildings. 
  • Three weeks after that (August 10th) Colombia was hit by a 7.4 quake, killing > 330 people, and causing massive infrastructure collapse. 
While we like to think that these sorts of events can't happen here in the United States, Canada, or Europe, the truth is more sobering.  

In 2006 the USGS calculated that earthquakes posed a significant risk to 75 million Americans living in 39 States. A 2015 study, published in the journal Earthquake Spectra, nearly doubled – to 143 million - the number of Americans who live or work in areas susceptible to potentially damaging ground shaking (see USGS: Nearly Half Of U.S. Population Exposed to Potentially Damaging Earthquakes).

In January of 2024 the USGS unveiled a new seismic risk map (see top of blog), which increased the percentage of the population at risk of experiencing a damaging earthquake to nearly 75% (roughly 240 million people).

While most people immediately think of California and the `big one', the New Madrid Seismic Zone (NMSZ), the Pacific Northwest (Cascadia fault), coastal South Carolina, Alaska and Hawaii, and even New York City and parts of New England are at risk of seeing significant seismic activity.

Additionally, there are nearly a dozen `very high risk' volcanoes in the continental US (4 in Washington, 4 in Oregon & 3 in California), along dozens of `lesser' threats. While earthquake damage is generally localized, volcanic eruptions can affect property and populations thousands of miles away.
Over the past 100+ years the United States (excluding Alaska & Hawaii) has experienced a `seismic drought', with relatively few big quakes or volcanic eruptions.  As a result, most people assume the next `big one' won't happen in their lifetimes. 

But all droughts end eventually.

Every year since 2009 I've promoted Shakeout.org's safety campaign, and I strongly urge anyone who lives in any seismically active region to take part. 


After the shaking stops, you'll have to find ways to cope with the aftermath. 
 
While the government will send help, you could find yourself pretty much on your own for several days (or longer) and living in less than comfortable conditions for weeks (assuming your home is still habitable).

For starters - and as a bare minimum - every household should have a disaster plan, a good first aid kit (and the knowledge to use it), an emergency battery operated NWS weather radio, and emergency supplies to last a minimum of 72 hours during a disaster.

While 72 hours is an admirable start, having previously lived very near the New Madrid fault, and now living in hurricane country, I wouldn't feel comfortable stopping there.

Many agencies and organizations in the U.S. recommend that households work towards having a 10-to-14 day supply of food, water, and emergency supplies on hand, which I consider far more prudent.

Other steps to consider include setting up emergency meeting places, out-of-state contacts, and creating individual wallet information cards (see #NatlPrep : Create A Family Communications Plan).

Seasonal Flu Signals From New Zealand, Australia & Japan


Credit CDC

#19,322

A week ago, in Japan MHLW Reports Unusually Early Start to the Fall Flu Season, we saw Japan's earliest start to their flu season since the 2009 H1N1 pandemic. The Ministry of Health's most recent (Sept 4th) update indicates that flu reports have jumped 60% since last week's figures were announced, with the highest rates reported in Okinawa Prefecture, followed by Iwate Prefecture, and Niigata Prefecture.

According to media reports today, the deployment of this year's seasonal flu vaccine (scheduled for late September) may begin for the elderly as early as this week. 
 
Meanwhile, in New Zealand, at a time when the Southern Hemisphere's flu season is usually winding down, the PHF Science website reports a late season surge in hospitalizations for (mostly) influenza. 


Most hospitalized (see chart below) are children aged 0-4 and the elderly (65+). 


Queensland, Australia is reporting a similar late-season surge (see chart below), although it has yet to reach the heights of last year's flu epidemic.

 
While none of this is necessarily predictive of the broader Northern Hemisphere flu season ahead, it is worth noting that after the late arrival last year of a `drifted' subclade K H3N2 virus, and recent antigenic changes observed in both H1N1 and Influenza B, the WHO has recommended changes to all 3 components of the 2026-2027 flu vaccine.
Overview

For vaccines for use in the 2026-2027 northern hemisphere influenza season, WHO recommends the following:

Egg-based vaccines

• an A/Missouri/11/2025 (H1N1)pdm09-like virus;

• an A/Darwin/1454/2025 (H3N2)-like virus; and

• a B/Tokyo/EIS13-175/2025 (B/Victoria lineage)-like virus.


Cell culture-, recombinant protein- or nucleic acid-based vaccines

• an A/Missouri/11/2025 (H1N1)pdm09-like virus;

• an A/Darwin/1415/2025 (H3N2)-like virus; and

• a B/Pennsylvania/14/2025 (B/Victoria lineage)-like virus.

The 2026 Southern Hemisphere vaccine already had the recommended updated H1N1 component, but retained the older strains against H3N2 and Influenza B.

Admittedly, seasonal flu is notoriously unpredictable - and a mild epidemic is always possible - but these early signals are worth noting. 

Sadly, seasonal flu vaccine uptake in the United States peaked in 2019, and has registered a slow, but steady decline since.

Pandemic fatigue, plus growing anti-vaccination sentiment, and admittedly `hit-or-miss' protection against influenza infection have all had an impact.  

While I'm not particularly hopeful - with antigenic changes in all 3 flu strains expected to circulate this winter - this would be a good year to see this trend reversed.  

For my part, I'll be rolling up my sleeve later this month, and plan to don face masks when in crowded indoor public spaces and use copious amounts of hand sanitizer.  

At my age, I figure I need every advantage I can get. 

Thursday, September 03, 2026

MMWR: Notes From the Field - Characteristics and Monitoring of the 2026 Outbreak of Ebola Disease . . . (DRC)

Figure 1. Distribution of cumulative confirmed cases
of the Congo, as of 26 August

#19,321

On May 15th Africa's CDC Convened an  Emergency Meeting After Reports of a Large Outbreak of Non-Zaire Ebola In the DRC, which was later confirmed to be Ebola Bundibugyo.  On May 20th the U.S. CDC issued a HAN (#00530) and 2 days later the ECDC released a Threat Assessment Brief. 


`Large-scale, rapid public health action is needed to control the current outbreak, already the largest known BVD outbreak, from becoming one of the largest Ebola epidemics in history.'

The most recent (Aug 28th) update from the WHO reports:

As of 26 August 2026, a total of 5794 confirmed cases, including 2786 deaths, have been reported, corresponding to a crude case fatality ratio (CFR) of 48.1%. These figures demonstrate a substantial increase in the scale and geographic extent of the outbreak over the past three months.
The crude case fatality ratio of 48% underscores the severity of the disease and ongoing challenges related to timely case detection, access to and quality of clinical care, and effective interruption of viral transmission. Delays in recognizing cases increase the likelihood of onward transmission within households, communities and healthcare facilities. The outbreak remains a public health emergency of international concern, following the advice of Emergency Committee meeting convened on 18 August.

This week, the CDC's MMWR has published a new assessment which finds that this Ebola outbreak is now the second largest on record, and it continues to expand rapidly. 

Despite concerted efforts, too many cases are being identified belatedly - many being treated or dying at home or outside of treatment centers - which prevents timely contact tracing and helps to enable community spread. 

 They report that `Nearly all operational indicators remain below identified targets (Table)'. 


While this MMWR report outlines areas where improvements are needed, efforts in that regard are complicated by an ongoing humanitarian emergency in the eastern part of the DRC which includes armed conflicts, limited healthcare infrastructure and availability, population displacement, and difficulty accessing affected communities.

Notes from the Field: Characteristics and Monitoring of the 2026 Outbreak of Ebola Disease Caused by Bundibugyo Virus — Democratic Republic of the Congo, August 2026

Early Release / September 1, 2026 / 75
Please note: This report has been corrected.
Dumazedier Kabasele1; Erika Meyer1; Issaka Kabore1; Amber Dismer1; Joelle K. Kabamba1; Anna Bratcher1; Constantin Kabwe Kola1; Carrie Eggers1; Delayo Zomahoun1; Noemi Hall1; Mutshiene Deogratias Ekwanzala1; Natalie Peters1; Amy Schuh1,2; Tara Sealy1; Philip Ricks1; Billy Mpianga Mutombo1; Michael Kinzer1; Benjamin A. Dahl1; Hyacinte Kabore1; Mary J. Choi1,2; John Rossow1,2; Sascha Ellington1; CDC 2026 Ebola Response International Epidemiology and Laboratory Task Force (VIEW AUTHOR AFFILIATIONS)View suggested citation


Summary

What is already known about this topic?

In May 2026, an outbreak of Ebola disease caused by Bundibugyo virus was identified in the Democratic Republic of the Congo.

What is added by this report?


This ongoing outbreak is now the second largest Ebola outbreak in history. The targets for five critical public health response indicators (case detection alerts, contact tracing, laboratory testing, isolation of infected persons, and safe and dignified burials) have not yet been met, and the outbreak continues to expand rapidly.

What are the implications for public health practice?

Substantial improvements in established outbreak control measures are crucial to rapidly detect and diagnose cases and isolate and provide treatment for infected persons, prevent funeral-associated transmission to prevent additional spread, and control this rapidly expanding outbreak.

The Democratic Republic of the Congo (DRC) Ministry of Public Health declared an Ebola outbreak on May 15, 2026 (1). Two days later, CDC activated its Emergency Operations Center as part of the U.S. government response to this rapidly growing outbreak (2). This report describes the epidemiologic characteristics and monitoring of the ongoing outbreak in DRC.

Investigation and Outcomes

The 2026 Ebola DRC outbreak caused by Bundibugyo virus is now the second largest Ebola outbreak ever recorded. As of August 21, 2026, DRC reported 5,458 confirmed cases and 2,606 (48%) confirmed deaths. Compared with previous Ebola outbreaks, the increase in cases in DRC is unprecedented, with approximately 5,000 cases in 100 days (Ebola Outbreak: Current Situation | CDC).

Cases have been reported from six of the 26 DRC provinces (Bas-Uélé, Haut-Uélé, Ituri, North Kivu, South Kivu, and Tshop), affecting 57 of 151 health zones in the affected provinces. Ituri province remains the outbreak epicenter, accounting for 84% of reported cases. Strategies known to control Ebola outbreaks include community-based surveillance, case detection alert notifications,* rapid and in-depth case investigations, identification and monitoring of contacts, infection control measures (e.g., prompt isolation of persons with suspected or confirmed Bundibugyo virus disease [BVD]), rapid diagnostic testing, mortality surveillance, and safe and dignified burials (SDBs).†

Data Source


Operational indicators for five domains have been generated based on experience with previous Ebola outbreaks, including DRC’s 2018 outbreak (3) (Table). Targets reflect the levels necessary to end the outbreak. The DRC Ministry of Public Health prepares publicly available daily situation reports, and CDC abstracts data from these reports to evaluate the established indicators each day. Indicator data are monitored over time to assess the outbreak trajectory. This activity was reviewed by CDC, deemed not research, and conducted consistent with applicable federal law and CDC policy.§

Operational Indicator Analysis

Nearly all operational indicators remain below identified targets (Table). Operational indicator values were calculated for the 21-day period of July 31–August 21. The average percentage of alerts investigated within 24 hours (last reported August 5, 2026) was 83% (target = >90%). An average of 10.6 contacts were identified per confirmed case (target = ≥20), suggesting underreporting and underascertainment of case contacts. The percentage of confirmed new cases previously identified as known contacts (last reported July 12, 2026) was 15%–20% (target = >90%); this suggests that most cases are occurring outside known transmission chains. In addition, more than one half (59%) of confirmed Ebola deaths are occurring outside an Ebola treatment unit (ETU) (target = 0%), suggesting insufficient ETU capacity, fear of ETUs, and ongoing spread through unidentified transmission chains. Laboratory testing was performed for 72% of validated alerts (target = >90%), indicating that a substantial number of suspected cases remain untested. Test positivity was 24%, with a target of 0%. Although the national ETU bed occupancy was 64%, meeting the target of <80%, occupancy varied substantially by health zone, with some facilities unable to isolate all infected persons and reporting occupancies as high as 140%. Fewer than one half (49%) of affected health zones had at least one SDB team (target = 100%). Current data were not available for several response indicators, such as percentage of persons with confirmed BVD receiving prompt isolation (target = >90%) and percentage of deaths with SDBs (target = 100%), underscoring ongoing data gaps in this complex public health response.

Preliminary Conclusions and Actions

As of August 21, 2026, most operational indicator measures remained below established response targets, and data for others were unavailable, indicating gaps in surveillance, contact tracing, laboratory testing, health care–seeking, isolation, and SDB capacity that limit control of the ongoing outbreak. These missing data and operational gaps, together with continued geographic expansion of the outbreak, a high percentage of deaths occurring outside ETUs, and a low percentage of cases among persons previously identified as contacts, indicate uncontrolled expansion of the outbreak. Public health response activities are complicated by a protracted complex humanitarian emergency in the eastern part of DRC, including armed conflict, limited health infrastructure, population displacement and mobility, and constraints on access to affected communities.

Containment and control of the 2026 Ebola disease outbreak requires integration and coordination of at least five response areas: 1) expansion of community-based surveillance systems ensuring rapid investigation of alerts; 2) improvements in contact tracing completeness and timeliness; 3) expansion of treatment and isolation capacity in affected health zones; 4) increased laboratory testing capacity, enabling prompt case identification; and 5) ensuring SDBs in affected health zones.

In addition, collecting robust, high-quality data regarding these operational actions is essential at the health zone level; CDC’s continued support to the DRC Ministry of Public Health and partners with improving data collection is critical. Collecting data at the level of the health zone facilitates timely local outbreak response decisions. Rapidly enhancing international humanitarian coordination and mobilizing global technical, operational, and other needed support are critical for accelerating the response and controlling the outbreak.