Showing posts with label Estimates. Show all posts

Wednesday, September 24, 2014

CDC Statements On MMWR Ebola Estimates

image


# 9006


Yesterday’s MMWR  worst case estimate of between 550,000 and 1.4 million Ebola cases in Liberia and Sierra Leone by the end of January - if interventions are not implemented - (see MMWR: Estimating The Future Number of Cases In The Ebola Epidemic) has garnered predictable headlines while the CDC’s caveats regarding the interpretation of  these numbers generally appears much further down the page.


CDC Director Dr. Thomas Frieden has been quick to point out that this report is based on `month-old data’ and that it doesn’t take into account recent and future interventions, but the `hook’  for most overnight reportage reads along the lines of:                                                                            

CDC estimates 1.4 million Ebola cases by Jan 

or 

Ebola Cases Could Reach 1.4 Million Within Four Months


The World Health Organization meanwhile has provided a far more subdued short-term projection that if interventions aren’t initiated the number of cases could climb to 20,000 by early November (see NEJM Ebola Virus Disease in West Africa — the First 9 Months and Forward Projections).


Both the CDC and WHO have expressed optimism that the `worst-case scenario’ can be avoided by the surge of international assistance now headed to the region. 


That said, rarely do major disaster response operations go as well as hoped, and the challenges presented by this crisis are unprecedented.  How much optimism is warranted is something we won’t know for several months.  


The CDC has released some ancillary documents for this MMWR report, including a statement from CDC Director Frieden and a Fact Sheet on the findings. Since these sorts of provisos often get short shrift in the media, I’ve provided links and excerpts below:


Media Statement

For Immediate Release: Tuesday, September 23, 2014
Contact:
Media Relations
(404) 639-3286

CDC Statement from the Director

Ebola is a critical issue for the world community. This week’s meetings in NY and Washington are a critical opportunity for increased international commitments and, more importantly, action.

The Ebola case estimates published today in the MMWR are based on data from August and reflect a moment in time before recent significant increases in efforts to improve treatment and isolation. They do not account for actions taken or planned since August by the United States and the international community. We anticipate that these actions will slow the spread of the epidemic.

The Ebola Response model is an important tool for people working to stop Ebola. It provides the ability to help Ebola response planners make more informed decisions on the emergency response to help bring the outbreak under control – and what can happen if these resources are not brought to bear quickly.

The model shows that there are severe costs of delay, and the need for increased resources and immediate and ongoing action by the international community.

It is still possible to reverse the epidemic, and we believe this can be done if a sufficient number of all patients are effectively isolated, either in Ebola Treatment Units or in other settings, such as community-based or home care.

Once a sufficient number of Ebola patients are isolated, cases will decline very rapidly – almost as rapidly as they rose.

Tom Frieden, M.D., M.P.H.
Director, Centers for Disease Control and Prevention


Excerpts from the Fact sheet:


New Modeling Tool for Response to Ebola Virus Disease

Ebola Response Modeling Tool
CDC has developed a dynamic modeling tool called Ebola Response that allows for estimations of projected cases over time in Liberia and Sierra Leone. The Ebola Response modeling tool was used to construct scenarios to illustrate how control and prevention interventions can slow and eventually stop the Ebola epidemic. Importantly, it can help planners make more informed decisions about emergency response resources to help bring the outbreak under control. It allows input of data reflective of the current situation on the ground in affected countries and communities. The Ebola Response modeling tool is intended to help local governments and international responders generate short-term estimates of the Ebola situations in countries, districts, and villages. The tool, in the form of a Microsoft Excel spreadsheet, will be freely available online.

<SNIP>

Projecting Ebola Case Estimates
Published today in MMWR, CDC used the Ebola Response modeling tool to calculate Ebola cases through mid- January in Sierra Leone and Liberia, providing an example of how this tool can be used. The MMWR estimates a range of between 550,000 and 1.4 million cases by January 20, 2015. The top range of the case estimate, 1.4 million, is explained by the model’s assumption that cases are significantly underreported by a factor of 2.5. It is essential to note that these numbers reflect a moment in time based on scientific and epidemiological data available in August, which did not account for the ongoing U.S. government Ebola relief effort. The numbers do not reflect current conditions. Modeling suggests that extensive, immediate actions – such as those already started – can bring the epidemic to a tipping point to start a rapid decline in cases.

The most important part of the report describes the potential effect of public health actions. The news is encouraging. If we do nothing, things could become much worse. If we take the actions that are planned, things will still be very hard, but we can stop Ebola. The United States and its partners are taking action every day.

Using the Ebola Response modeling tool, we see that the epidemic can begin to be controlled when individuals with Ebola are effectively isolated in Ebola treatment units (ETUs) or in isolation settings in which there is a reduced risk of Ebola transmission. The model also shows a benefit when safe burial practices are implemented that eliminate exposure of healthy individuals to the bodily fluids of the deceased, which often occurs with the use of traditional burial practices. The model indicates that once a tipping point is reached, cases will decline about as rapidly as they had increased. Of note, gains below such a tipping point can also significantly reduce cases.

Tuesday, September 23, 2014

MMWR: Estimating The Future Number of Cases In The Ebola Epidemic


image
Credit CDC PHIL


# 9005


The much anticipated (and already telegraphed) MMWR report modeling the possible future number of Ebola cases in Liberia and Sierra Leone has now been published, and they paint a dire picture where between 550,000 to 1.4 million infections could result over the next four months if interventions are not successful.  


At the same time the CDC held a press conference where Director Dr. Thomas Frieden warned that these numbers are based on `month-old data’, don’t reflect current and future progress in controlling the outbreak, and that  these `worst-case’ scenarios are unlikely to unfold.


With a range of possibilities running from a few tens of thousands of cases to well over a million, everything hinges on the speed and effectiveness of international efforts to mitigate the spread of this virus.  And while one remains hopeful the tide in that endeavor has begun to turn, it is far too soon to know how much impact they will ultimately have, and how soon they will gain traction.


Which means  - where we really are, and how bad this outbreak becomes - is likely to remain uncertain for some weeks to come.


Given the vagueness of today’s case counts, I haven’t found any compelling reason to embrace any single one of these recently published models over the others.  That said, I don’t discount any of them, either. 


My personal take is that things on the ground are probably worse than we know, and it is going to take a herculean international effort – and more than a bit of luck – if this epidemic is to be brought under control anytime soon. 


Follow the link to read the full MMWR report.


Estimating the Future Number of Cases in the Ebola Epidemic — Liberia and Sierra Leone, 2014–2015

Early Release

September 23, 2014 / 63(Early Release);1-4

Martin I. Meltzer, PhD1, Charisma Y. Atkins, MPH1, Scott Santibanez, MD1, Barbara Knust, DVM2, Brett W. Petersen D2, Elizabeth D. Ervin, MPH2, Stuart T. Nichol, Ph.D2 , Inger K. Damon, MD, PhD2, Michael L. Washington, PhD1

Corresponding author: Martin I. Meltzer, National Center for Emerging and Zoonotic Infectious Diseases, CDC. E-mail: qzm4@cdc.gov; Telephone: 404-639-7778.

Abstract

The first cases of the current West African epidemic of Ebola virus disease (hereafter referred to as Ebola) were reported on March 22, 2014, with a report of 49 cases in Guinea. By August 31, 2014, a total of 3,685 probable, confirmed, and suspected cases in West Africa had been reported. To aid in planning for additional disease-control efforts, CDC constructed a modeling tool called EbolaResponse to provide estimates of the potential number of future cases. If trends continue without scale-up of effective interventions, by September 30, 2014, Sierra Leone and Liberia will have a total of approximately 8,000 Ebola cases.

A potential underreporting correction factor of 2.5 also was calculated. Using this correction factor, the model estimates that approximately 21,000 total cases will have occurred in Liberia and Sierra Leone by September 30, 2014. Reported cases in Liberia are doubling every 15–20 days, and those in Sierra Leone are doubling every 30–40 days. The EbolaResponse modeling tool also was used to estimate how control and prevention interventions can slow and eventually stop the epidemic.

In a hypothetical scenario, the epidemic begins to decrease and eventually end if approximately 70% of persons with Ebola are in medical care facilities or Ebola treatment units (ETUs) or, when these settings are at capacity, in a non-ETU setting such that there is a reduced risk for disease transmission (including safe burial when needed). In another hypothetical scenario, every 30-day delay in increasing the percentage of patients in ETUs to 70% was associated with an approximate tripling in the number of daily cases that occur at the peak of the epidemic (however, the epidemic still eventually ends). Officials have developed a plan to rapidly increase ETU capacities and also are developing innovative methods that can be quickly scaled up to isolate patients in non-ETU settings in a way that can help disrupt Ebola transmission in communities. The U.S. government and international organizations recently announced commitments to support these measures. As these measures are rapidly implemented and sustained, the higher projections presented in this report become very unlikely.

(Continue . . . )

Saturday, September 13, 2014

The Very Model Of A Modern Major General Public Health Disaster

image

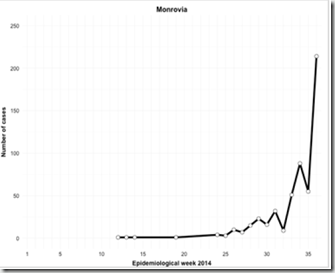
The Epi Curve from Monrovia


# 9072


In two short weeks we’ve gone from viewing the World Health Organization’s warning that as many as 20,000 people in West Africa could be infected by the Ebola virus as being a worst case scenario, to that being among the more optimistic estimates. 


While no one knows for certain how bad things will become, partly because there isn’t a lot of confidence in our understanding of how bad things are now, the forecasts are becoming increasingly dire, with some estimates in the hundreds of thousands by year’s end.


George E. P. Box, Professor Emeritus of Statistics at the University of Wisconsin, famously declared that All models are wrong, but some models are useful.” , which helps to explain the huge diversity in estimatesAs does the computer programmers creed: GIGOgarbage in: garbage out.

Which means we probably shouldn’t latch too firmly to any of these estimates, but we should recognize the general (dismal) direction in which all of them are leaning.


Yesterday, Deutsche Welle carried a report - Ebola threatens to destroy Sierra Leone and Liberia – where German Virologist Jonas Schmidt-Chanasit  provides an even more apocalyptic forecast, saying the virus will likely become `endemic’ in those countries, and that most of their population could ultimately be infected.


Overnight the New York Times ran an article called Scientists present dire Ebola projection which carried this lede:

The deadly Ebola outbreak sweeping across three countries in West Africa is likely to last 12 to 18 months more, much longer than anticipated, and could infect hundreds of thousands of people before it is brought under control, say scientists mapping its spread for the federal government.

While there are mitigation efforts that could still blunt these projected impacts  and shorten this epidemic, for that to happen, it will require an unprecedented international effort, and some very good luck with the development of vaccines.  

And while the world tries to respond to this staggering Ebola outbreak, overburdened public health agencies around the globe will also be tasked with playing Whack-A-Mole against a variety disease threats with global aspirations – like Avian flu in Asia (H7N9, H10N8, H5N1), MERS-CoV in the Middle East, and of course the one we don’t know about yet . . . Virus X.


Given the the number and size of these threats, rather than cutting back on public health budgets, we really need be investing in a bigger mallet;  A global public health response team with the resources, and international backing, to investigate and coordinate a response to future emerging disease threats before they can spiral out of control.


Because the next threat that comes down the pike could make the carnage wrought by Ebola pale in comparison.


Saturday, June 29, 2013

CID Journal: Estimates Of Human Infection From H3N2v (Jul 2011-Apr 2012)

 image

Credit CDC


# 7435


In my last post (see CID Journal: Lessons From The `First Wave’ Of H3N2v) I recounted the history of the `first wave’ of the H3N2v swine variant virus (July 2011-Apr 2012) as part of a lead up to a series of articles just published in a supplement to the journal Clinical Infectious Diseases.


While only 13 human infections were detected during this 9 month time span, it is considered more than probable that a significant number of cases went undetected.


We know with practically every infectious disease you can name, that surveillance and testing only picks up a fraction of the total number of cases.  The proverbial `tip of the iceberg’ or in the case of the graphic below, the `top of the pyramid’


surveillance

Credit CDC 


As an example, last year the CDC was notified of 5,674 cases of West Nile virus disease in people, including 286 deaths. But the actual number of WNV infections (including mild & asymptomatic cases) may have been well over 100,000.


Similarly, we don’t actually know how many people contract, or even die from, influenza each year in the United States. With all of these diseases, the number of cases each year must be estimated, based on available surveillance and testing and mathematical modeling.


Which brings us to a study that attempts to extrapolate - using models developed during the opening months of the 2009 H1N1 pandemic - how many undetected cases of H3N2v may have occurred during this first wave (July 2011 – April 2012) when only 13 cases were confirmed.


Their results – that more than 2,000 human infections from H3N2v may have occurred during this time -  I suspect, will surprise a lot of people.


Estimates of the Number of Human Infections With Influenza A(H3N2) Variant Virus, United States, August 2011–April 2012

Matthew Biggerstaff, Carrie Reed, Scott Epperson, Michael A. Jhung, Manoj Gambhir, Joseph S. Bresee, Daniel B. Jernigan, David L. Swerdlow, and Lyn Finelli

Background. Thirteen human infections with an influenza A(H3N2) variant (H3N2v) virus containing a combination of gene segments not previously associated with human illness were identified in the United States from August 2011 to April 2012. Because laboratory confirmation of influenza virus infection is only performed for a minority of ill persons and routine clinical tests may not identify H3N2v virus, the count of laboratory-confirmed H3N2v virus infections underestimates the true burden of illness.


<SNIP  Methods>

Results. We estimate that the median multiplier for children was 200 (90% range, 115–369) and for adults was 255 (90% range, 152–479) and that 2055 (90% range, 1187–3800) illnesses from H3N2v virus infections may have occurred from August 2011 to April 2012, suggesting that the new virus was more widespread than previously thought.


Their estimates range from just under 1,200 cases to nearly 4,000 for this `first wave’. 

The `second wave’ began in late June 2012, and ran well into the fall, resulted in more than 300 confirmed cases. This study strongly suggests that those represented but a tiny fraction of the `true’ number of infections last summer.


Granted, the surveillance picture during the second wave – once the news broke that scores of people attending county & state fairs had contracted the virus – likely changed from during the first wave.


My guess is that these multipliers may need a bit of tweaking for use with the second wave, to account for more robust surveillance and testing that was put into place. 


But even so, the number of undetected cases last summer was likely many-fold greater than the 300 confirmed infections turned up by surveillance.


This past week, we learned of four new cases (see CDC FluView Update On H3N2v Cases) linked to attendance at a county fair in Indiana.


Given the prevalence of the H3N2v virus in swine, and the increased potential for exposure over county & state fair season (running from June-November), it seems likely we’ll be hearing a good deal more about this variant flu virus in the coming months.


Despite these numbers, and apparent limited human-to-human transmission of this virus, this strain has not yet managed to spread efficiently in the community.


The CDC maintains an H3N2v and You FAQ page, and offers the following advice for fairgoers and exhibitors.


Preventive Actions

CDC Recommendations For People At High Risk:

  • If you are at high risk of serious flu complications and are going to a fair where pigs will be present, avoid pigs and swine barns at the fair this year. This includes children younger than 5 years, people 65 years and older, pregnant women, and people with certain long-term health conditions (like asthma, diabetes, heart disease, weakened immune systems, and neurological or neurodevelopmental conditions).

If you are not at high risk, take these precautions:

  • Don’t take food or drink into pig areas; don’t eat, drink or put anything in your mouth in pig areas.
  • Don’t take toys, pacifiers, cups, baby bottles, strollers, or similar items into pig areas.
  • Wash your hands often with soap and running water before and after exposure to pigs. If soap and water are not available, use an alcohol-based hand rub.
  • Avoid close contact with pigs that look or act ill.
  • Take protective measures if you must come in contact with pigs that are known or suspected to be sick. This includes minimizing contact with pigs and wearing personal protective equipment like protective clothing, gloves and masks that cover your mouth and nose when contact is required.
  • To further reduce the risk of infection, minimize contact with pigs and swine barns.


Monday, November 26, 2012

Revisiting The Numbers Racket


# 6739


An excellent piece by Kelly Crowe of CBC News over the weekend questions the credibility of flu mortality numbers and reminds us, once again, that in public health easy answers are often the hardest to deliver.


First a link to the article, which I encourage you to read in its entirety. 


Flu deaths reality check

Credibility of flu models disputed
By Kelly Crowe, CBC News
Posted: Nov 25, 2012 5:14 PM ET

Do thousands of Canadians really die every year from the flu? The flu folks keep saying so. I've already heard it repeated several times this year and flu season has just started. This is what the Public Health Agency of Canada said in a recent press release: "Every year, between 2,000 and 8,000 Canadians die of the flu and its complications."

(Continue . . . )


Long time visitors to this blog will recall that we’ve trod this perilous path before - for both seasonal and pandemic flu - along with a variety of other diseases.  


Quite understandably, the public and the media expect public health officials to have some kind of handle on the number of deaths caused by infectious diseases in our society. 


Particularly with something as ubiquitous as flu.


But the truth is, no one really knows.


After more than a decade of promoting the `flu kills roughly 36,000 Americans each year’ meme, the CDC revised (and hopefully improved) their estimates in 2010 ( see MMWR: Estimates Of Yearly Seasonal Influenza Deaths)


For deaths with underlying pneumonia and influenza causes (the most narrow definition of flu-related fatalities used) the models estimated a yearly average of 6,309 (range: 961 in 1986--87 to 14,715 in 2003--04) influenza-associated deaths.


Using a broader criteria (underlying respiratory and circulatory causes including pneumonia and influenza causes)  the models estimated an annual average of 23,607 (range: 3,349 in 1986--87 to 48,614 in 2003--04) influenza-associated deaths.


Despite the 12-fold difference in deaths between the 1986-87 and 2003-04 seasons, the operative word here remains `estimated’. 


  • Estimates are extrapolated based on a surveillance subset of the country, not the whole nation
  • There are often co-circulating viruses that may influence overall mortality.
  • Surveillance, testing, and reporting may change over time
  • Different mathematical models can produce differing results
  • There are varying opinions as to what constitutes an influenza-related fatality.


When combined with the inevitable variations in the severity of influenza seasons (H3 years are usually more severe than H1 years), this makes it impossible to derive a single number that `works’.


In an attempt not to compound a felony, I try to leave it as influenza `kills thousands each year’ or `is the cause of substantial mortality’ in this blog. Sometimes I’ll use the range (3,000-48,000) offered by the CDC, but most of the time I don’t.


The same holds true for just about any illness or disease you’d care to mention. 


Ask the CDC how many people contracted West Nile Fever this summer, and they will tell you that (as of Nov. 20th) they had recorded  5,207 cases of West Nile virus disease in people, including 234 deaths, but that the real number may be 50 times higher.


Severe (neuroinvasive) cases are pretty easy to spot, but they estimate only 1%-3% of mild cases of West Nile Fever are diagnosed and reported.


If we do the math, and assume the 2654 non-neuroinvasive cases officially reported constitute between 1% and 3% of the total number of actual cases we get a range of between 250,000 and 85,000 infections.


The chart below illustrates the problem nicely. 


surveillance


Relying only on lab confirmed fatalities isn’t much of a solution, either. The `official’ death toll for the 2009 pandemic - as reported by the World Health Organization  - was roughly 18,000 deaths globally.


The WHO offered this disclaimer:


The reported number of fatal cases is an under representation of the actual numbers as many deaths are never tested or recognized as influenza related.World Health Organization.


Unfortunately, the mainstream media often reported the low official number of deaths without adequately explaining the acknowledged gaps in the data, leading many to believe that the 2009 pandemic was a damp squib.


In contrast, earlier this year, in Lancet: Estimating Global 2009 Pandemic Mortality, we saw a study who’s estimate found:


We estimate that globally there were 201 200 respiratory deaths (range 105 700—395 600) with an additional 83 300 cardiovascular deaths (46 000—179 900) associated with 2009 pandemic influenza A H1N1. 80% of the respiratory and cardiovascular deaths were in people younger than 65 years and 59% occurred in southeast Asia and Africa.


With no way to accurately count cases, analysts are reduced to creating mathematical models, fueled by both hard data and assumptions, in order to extrapolate the impact of diseases on the population.


The old adage (well, not that old, as it is attributed to George E. P. Box, Professor Emeritus of Statistics at the University of Wisconsin) is that:


“All models are wrong, but some models are useful.”


To that I would add, that while useful, mathematical models can be extraordinarily difficult to defend.


It requires agreement over assumptions.  And among academics, that’s never easy to reach.


Going hand-in-hand with the estimates of flu deaths each year has been the purported effectiveness of the seasonal flu shot.


Up until about a year ago the CDC’s mantra has been for healthy adults under the age of 65, in years when the vaccine is a good match to circulating strains, effectiveness ranges from 70%-90%.


Despite these important qualifiers, the message often ended up being shortened in the media to the flu vaccine being `up to 90% effective’.


A little more than a year ago the CDC updated their FAQ on Flu Vaccine effectiveness, and as part of a much longer detailed posting, lowered their estimate of the inactivated flu shot’s effectiveness to read:


. . . recent RCTs of inactivated influenza vaccine among adults under 65 years of age have estimated 50-70% vaccine efficacy during seasons in which the vaccines' influenza A components were well matched to circulating influenza A viruses.


A number that pretty much matched CIDRAP’s finding (see A Comprehensive Flu Vaccine Effectiveness Meta-Analysis) which would be released a couple of weeks later. That analysis showed the trivalent inactivated vaccine (TIV) had a combined efficacy of 59% among healthy adults (aged 18–65 years).


So what are we left with?


Well, every time we get into statistics (admittedly not my strong suit) I’m reminded of the story of the statistician who drowned trying to ford a river that was, on average, only 3 feet deep.


Still I think we can safely draw a few conclusions.


Influenza-like-Illnesses (ILIs) obviously contribute to a good deal of morbidity and mortality each year. 


In addition to influenza, these illnesses can be caused by the metapneumovirus, parainfluenzavirus, respiratory syncytial virus (RSV), adenoviruses, or any of the myriad Rhinoviruses (Common cold).  Among others.


The percentage of these illnesses that are actually due to the influenza virus varies considerably from year to year, and so only a portion of these deaths are actually `vaccine preventable’.


Today’s influenza vaccine, whose effectiveness is described as just `moderate’ by CIDRAP’s recent 160-page Comprehensive Influenza Vaccine Initiative (CCIVI) report, undoubtedly saves lives and reduces hospitalization, but is not the panacea that many would hope for.


image


Hence the call for better vaccines.  


Despite their limitations, I still get a flu vaccine each year, as I believe partial protection beats no protection any day of the week.


As far as the estimate of deaths from influenza are concerned, I doubt this debate can really be solved to everyone’s satisfaction. There is no single, `good’ answer when the parameters change as often as they do with influenza.


We live in a world driven by easily adopted memes, 10 second sound bytes, and 140 character tweets.


As a result, officials are often tempted to provide us with simplified, easy to digest, answers. While brevity may have many advantages, scientific precision is rarely one of them. 


Of course, if someone comes up with a better way to measure the number of deaths from influenza each year, I’ll feature it in this blog.  Until that happens, I’ll simply leave it as the cause of `substantial mortality’.

Tuesday, June 26, 2012

Lancet: Estimating Global 2009 Pandemic Mortality


# 6505


Sounding a bit like a broken record, during the first 12 months of the 2009 pandemic I wrote repeatedly on our inability to accurate count – or even estimate – the number of H1N1 flu deaths in the United States and around the globe.


Just a few of those posts include:


Dead Reckoning
The Tip Of The Iceberg
When No Number Is Right
Apples, Oranges, And Influenza Death Tolls


The CFR, or case fatality ratio is generally seen as the most important statistic in any pandemic, and yet it is often the hardest to quantify. This number is the percentage of people who, once infected, die (either directly or indirectly) as a result of that infection.


While that may seem a simple enough task , the truth is that even during a `normal’ flu season the CDC can only estimate the number of deaths in the United States related to influenza.


The problem is, influenza can provoke or exacerbate many other medical problems. Influenza can obviously lead to pneumonia and death, but it has also been linked to heart attacks, strokes (CVAs), and other potentially fatal health crises.


Most of the time, the attending doctor signs the death certificate and puts down the most immediate or obvious cause of death.  If influenza was a factor, it rarely is noticed or noted.


The official numbers we get from the CDC, the World Health Organization, and from individual countries are almost always referred to as `the tip of the iceberg’, or as in the graphic below, the tip of the pyramid.


surveillance


And this is the best we can do in developed countries, where the majority of people have at least some access to medical care and where governments make an attempt to maintain public health records and death registries.


For much of the rest of the world, these are luxuries that are too often unavailable.


As an example, in November of 2009, in Zhong Nanshan On China’s Death Toll, one of the real heroes of the 2003 SARS epidemic, openly questioned the low number of deaths being reported out of China.


The truth is, in many countries, no one was counting the dead. 


In South Africa, where nearly 1,000 AIDS/HIV deaths occur each day, no one was looking to see if flu was a factor.  No one had the time, and it simply wasn’t in the budget.  


The `official’ death toll, as reported by the World Health Organization was roughly 18,000 deaths globally,  but the WHO offered this disclaimer:


The reported number of fatal cases is an under representation of the actual numbers as many deaths are never tested or recognized as influenza related.World Health Organization.


Unfortunately, the mainstream media often reported the low official number of deaths without adequately explaining the acknowledged gaps in the data, leading many to believe that the 2009 pandemic was a damp squib.


The CDC stopped counting H1N1 influenza deaths in the summer of 2009, realizing that their official tally was more misleading that helpful.


In November of that year, they released their first estimate of the number of U.S. pandemic flu infections, hospitalizations, and deaths (see  CDC Releases Revised Hospitalization & Death Estimates), where they estimated that between about 2,500 and 6,000 2009 H1N1-related deaths occurred between April and October 17, 2009.


Two months later (see CDC Updates Estimates Of Infections, Hospitalizations, and Deaths From H1N1) the the CDC updated their estimates to carry through to the 12th of December. Their mid-range estimates were of 55 million infections and 11,160 deaths in the US from H1N1 since April of 2009.


Today, a study appears in The Lancet that attempts to estimate the number of global H1N1 deaths during the first year of the pandemic, and it comes up with a number than runs between 15 and 30 times higher than reported to the WHO.

Estimated global mortality associated with the first 12 months of 2009 pandemic influenza A H1N1 virus circulation: a modelling study

Dr Fatimah S Dawood MD , A Danielle Iuliano PhD, Carrie Reed DSc , Martin I Meltzer PhD , David K Shay MD, Po-Yung Cheng PhD, Don Bandaranayake MBBS , Robert F Breiman MD , W Abdullah Brooks MD , Philippe Buchy MD , Daniel R Feikin MD, Karen B Fowler DrPH , Aubree Gordon PhD , Nguyen Tran Hien MD , Peter Horby MBBSl, Q Sue Huang PhD , Mark A Katz MD , Anand Krishnan MBBS , Renu Lal PhD , Joel M Montgomery PhD , Kåre Mølbak MDo, Richard Pebody MBBS, Anne M Presanis PhD , Hugo Razuri MD , Anneke Steens MSc , Yeny O Tinoco DVM , Jacco Wallinga PhD , Hongjie Yu MDr, Sirenda Vong MD , Joseph Bresee MD , Dr Marc-Alain Widdowson VetMB

Findings

We estimate that globally there were 201 200 respiratory deaths (range 105 700—395 600) with an additional 83 300 cardiovascular deaths (46 000—179 900) associated with 2009 pandemic influenza A H1N1. 80% of the respiratory and cardiovascular deaths were in people younger than 65 years and 59% occurred in southeast Asia and Africa.


While most of this report is behind a pay wall, the CDC - which co-authored the study -  has posted a summary on their website.


CDC Releases First Global Estimates of 2009 H1N1 Pandemic Mortality

Photo: transparent globe representing the scope of the global estimates used in the CDC study of 2009 H1N1 pandemic mortality.

June 25, 2012 -- A study published today in The Lancet Infectious Diseases Online FirstExternal Web Site Icon provides the first global estimates of how many people died as a result of the 2009 H1N1 influenza pandemic. The study, co-authored by 9 members of the CDC Influenza Division, used an improved modeling approach which resulted in an estimated range of deaths from between 151,700 and 575,400 people who perished worldwide from 2009 H1N1 virus infection during the first year the virus circulated. A disproportionate number of deaths occurred in Southeast Asia and Africa, where access to prevention and treatment resources are more likely to be limited. Study authors hope that this work can be used not only to improve how influenza deaths are estimated, but also to improve the public health response during future pandemics in parts of the world that suffer more influenza-related deaths.


These global estimates are more than 15 times higher than the number of laboratory-confirmed deaths reported to the World Health Organization (WHO). WHO has acknowledged for some time that official, lab-confirmed reports are an underestimate of actual number of influenza deaths. Diagnostic specimens are not always collected from people who die with influenza; for others, influenza virus may not be detectable by the time of death. Because of these challenges, modeling is used to estimate the actual burden of disease.

<SNIP>

2009 H1N1 Pandemic Hits the Young Especially Hard

This study estimated that 80% of 2009 H1N1 deaths were in people younger than 65 years of age which differs from typical seasonal influenza epidemics during which 80-90% of deaths are estimated to occur in people 65 years of age and older. To illustrate the impact of the shift in the age distribution of influenza deaths to younger age groups during the pandemic, researchers calculated the number of years of life lost due to 2009 H1N1-associated deaths. They estimated that 3 times as many years of life were lost during the first year of 2009 H1N1 virus circulation than would have occurred for the same number of deaths during a typical influenza season.

(Continue . . . )


This age shift to younger victims was frequently noted during the pandemic, and in the spring of 2010 a study appeared that found that the mean age of death from the novel H1N1 virus has been calculated to be half that of seasonal flu, or 37.4 years.


In terms of years of life lost (YLL), the average pandemic flu death had a many fold greater impact than the average seasonal flu fatality – often robbing decades of potential life from its victims.


Preliminary Estimates of Mortality and Years of Life Lost Associated with the 2009 A/H1N1 Pandemic in the US and Comparison with Past Influenza Seasons

By Cecile Viboud, Mark Miller, Don Olson, Michael Osterholm et al (5 authors)


All of which makes the impact of the 2009 pandemic – in real terms – greater than most people realize.


Today’s new estimate is unlikely to be the last word on this subject. As more data is analyzed and new mathematical models are developed, better estimates will be generated.


We’ll never know the true number, of course.  Some things are not directly measureable. But having more accurate estimates can go a long ways towards helping us plan for the next pandemic.


And as most researchers acknowledge: that isn’t a matter of `if’, it’s just a matter of `when’.

Friday, January 15, 2010

CDC Updates Estimates Of Infections, Hospitalizations, and Deaths From H1N1


# 4259


Attempts to count individual deaths from the H1N1 virus in the US ceased during the summer when it was determined that it was no longer possible to keep any kind of accurate tally.


That was expected since, even during a regular flu season, we don’t count individual flu deaths.  The oft repeated number of 36,000 flu-related deaths annually is an estimate.


In November the CDC released their estimates of the pandemic’s impact here in the US up until mid-October.  At that time, they estimated 22,000,000 people had been infected and roughly 4,000 had died.


In December, the CDC has updated those numbers through November 14th, and they show a significant increase over the previous numbers.  A mid-range estimate of 47 million infections and nearly 10,000 deaths.


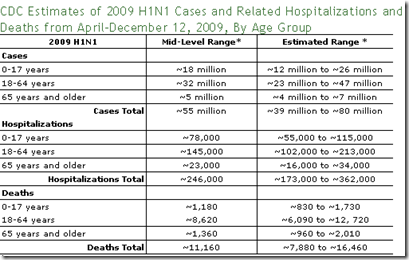
Today, the CDC once again updates their estimates to carry through to the 12th of December.    Their mid-range estimates are of 55 million infections and 11,160 deaths in the US from H1N1 since April of 2009.


CDC Estimates of 2009 H1N1 Influenza Cases, Hospitalizations and Deaths in the United States, April – December 12, 2009

January 15, 2010 1:00 PM ET

April – October 17 Estimates
April – November 14 Estimates

On this Page
Background

Estimating the number of individual flu cases in the United States is very challenging because many people with flu don’t seek medical care and only a small number of those that do seek care are tested. More people who are hospitalized or die of flu-related causes are tested and reported, but under-reporting of hospitalizations and deaths occurs as well. For this reason CDC monitors influenza activity levels and trends and virus characteristics through a nationwide surveillance system and uses statistical modeling to estimate the burden of flu illness (including hospitalizations and deaths) in the United States.

When the 2009 H1N1 flu outbreak began in April 2009, CDC began tracking and reporting the number of laboratory-confirmed 2009 H1N1 cases, hospitalizations and deaths as reported by states to CDC. These initial case counts (which were discontinued on July 24, 2009), and subsequent ongoing laboratory-confirmed reports of hospitalizations and deaths, are thought to represent a significant undercount of the actual number of 2009 H1N1 flu cases in the United States. A paper in Emerging Infectious Diseases authored by CDC staff entitled “Estimates of the Prevalence of Pandemic (H1N1) 2009, United States, April–July 2009” reported on a study to estimate the prevalence of 2009 H1N1 based on the number of laboratory-confirmed cases reported to CDC. Correcting for under-ascertainment, the study found that every case of 2009 H1N1 reported from April – July represented an estimated 79 total cases, and every hospitalized case reported may have represented an average of 2.7 total hospitalized people. CDC then began working on a way to estimate, in an ongoing way, the impact of the 2009 H1N1 pandemic on the U.S. in terms of 2009 H1N1 cases, hospitalizations and deaths. CDC developed a method to provide an estimated range of the total number of 2009 H1N1 cases, hospitalizations and deaths in the United States by age group using data on flu associated hospitalizations collected through CDC’s Emerging Infections Program.[e1]

The Numbers

(Print tableAdobe PDF file)

On November 12, 2009 CDC provided the first set of estimates on the numbers of 2009 H1N1 cases and related hospitalizations and deaths in the United States between April and October 17, 2009.

Estimates from April – October 17, 2009:

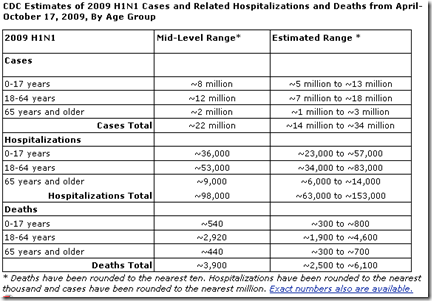
  • CDC estimated that between 14 million and 34 million cases of 2009 H1N1 occurred between April and October 17, 2009. The mid-level in this range was about 22 million people infected with 2009 H1N1.
  • CDC estimated that between about 63,000 and 153,000 2009 H1N1-related hospitalizations occurred between April and October 17, 2009. The mid-level in this range was about 98,000 H1N1-related hospitalizations.
  • CDC estimated that between about 2,500 and 6,000 2009 H1N1-related deaths occurred between April and October 17, 2009. The mid-level in this range was about 3,900 2009 H1N1-related deaths.

Updated Estimates from April – November 14, 2009

Using the same methodology CDC updated the estimates to include the time period from April through November 14, 2009 on December 10, 2009.

  • CDC estimated that between 34 million and 67 million cases of 2009 H1N1 occurred between April and November 14, 2009. The mid-level in this range was about 47 million people infected with 2009 H1N1.
  • CDC estimated that between about 154,000 and 303,000 2009 H1N1-related hospitalizations occurred between April and November 14, 2009. The mid-level in this range was about 213,000 H1N1-related hospitalizations.
  • CDC estimated that between about 7,070 and 13,930 2009 H1N1-related deaths occurred between April and November 14, 2009. The mid-level in this range was about 9,820 2009 H1N1-related deaths.

Updated Estimates from April – December 12, 2009

Using the same methodology CDC has updated the estimates to include the time period from April through December 12, 2009.

  • CDC estimates that between 39 million and 80 million cases of 2009 H1N1 occurred between April and December 12, 2009. The mid-level in this range is about 55 million people infected with 2009 H1N1.
  • CDC estimates that between about 173,000 and 362,000 2009 H1N1-related hospitalizations occurred between April and December 12, 2009. The mid-level in this range is about 246,000 H1N1-related hospitalizations.
  • CDC estimates that between about 7,880 and 16,460 2009 H1N1-related deaths occurred between April and December 12, 2009. The mid-level in this range is about 11,160 2009 H1N1-related deaths.

Note: Less than 5% of increases in the estimates from one reporting date to the next are the result of delayed reporting in cases, hospitalizations and deaths.

image

The previous estimates of 2009 H1N1 cases, hospitalizations and deaths through November 14 encompassed the peak of 2009 H1N1 activity in the United States. The latest estimates through December 12 show a modest increase in the total number of 2009 H1N1 cases, hospitalizations and deaths since the 2009 H1N1 virus emerged. The additional four weeks of flu activity data added to the previous estimate correlate with a four week period of decreasing flu activity in the United States.

Thursday, December 10, 2009

CDC Updates Their H1N1 Fatality Estimates


# 4146


Attempts to count individual deaths from the H1N1 virus in the US ceased during the summer when it was determined that it was no longer possible to keep any kind of accurate tally.   


That was expected since, even during a regular flu season, we don’t count individual flu deaths.  The oft repeated number of 36,000 flu-related deaths annually is an estimate.


In November the CDC released their estimates of the pandemic’s impact here in the US up until mid-October.  At that time, they estimated 22,000,000 people had been infected and roughly 4,000 had died


Today, the CDC has updated those numbers through November 14th, and they show a significant increase over the previous numbers.  A mid-range estimate of 47 million infections and nearly 10,000 deaths.

image


The Numbers

On November 12, 2009 CDC provided the first set of estimates on the numbers of 2009 H1N1 cases and related hospitalizations and deaths in the United States between April and October 17, 2009.

Estimates from April – October 17, 2009:

  • CDC estimated that between 14 million and 34 million cases of 2009 H1N1 occurred between April and October 17, 2009. The mid-level in this range was about 22 million people infected with 2009 H1N1.
  • CDC estimated that between about 63,000 and 153,000 2009 H1N1-related hospitalizations occurred between April and October 17, 2009. The mid-level in this range was about 98,000 H1N1-related hospitalizations.
  • CDC estimated that between about 2,500 and 6,000 2009 H1N1-related deaths occurred between April and October 17, 2009. The mid-level in this range was about 3,900 2009 H1N1-related deaths.

Updated Estimates from April – November 14, 2009

Using the same methodology CDC has updated the estimates to include the time period from April through November 14, 2009.

  • CDC estimates that between 34 million and 67 million cases of 2009 H1N1 occurred between April and November 14, 2009. The mid-level in this range is about 47 million people infected with 2009 H1N1.
  • CDC estimates that between about 154,000 and 303,000 2009 H1N1-related hospitalizations occurred between April and November 14, 2009. The mid-level in this range is about 213,000 H1N1-related hospitalizations.
  • CDC estimates that between about 7,070 and 13,930 2009 H1N1-related deaths occurred between April and November 14, 2009. The mid-level in this range is about 9,820 2009 H1N1-related deaths.

Note: More than 95% of the increases in the estimated numbers of 2009 H1N1 cases, hospitalizations and deaths between the November 12 and December 10 estimates occurred between October 17 and November 14, 2009. (Less than 5% of increases are the result of delayed reporting in cases, hospitalizations and deaths that occurred prior to October 17, 2009.)


You can read more about the methods used to come up with these numbers on the CDC’s website HERE.


You can find previous discussions on the reasons why the official counts under represent the true number of cases, hospitalizations, and deaths in the following blog entries:


Medical Examiner: H1N1 Deaths Understated
When No Number Is Right
Dead Reckoning
Numbers Don’t Tell The Whole Story
A Decided Lack Of Data
Measuring The Severity Of A Pandemic
 

Friday, November 20, 2009

Medical Examiner: H1N1 Deaths Understated


# 4048


A subject we’ve discussed many times before, but it is always good to get confirmation from someone in the field, who is actually seeing the victims of this pandemic. 


In this case, a county Medical Examiner.


The CDC has estimated that, as of more than a month ago, roughly 3,900 Americans had died from the virus.  Several times higher than than previously reported. 


image


Many deaths will go uncounted because not everyone who dies as a result of the H1N1 virus will get tested or autopsied, and many of those won’t show the pneumonia signatures that this medical examiner is seeing.


For more information on the difficulties in detecting and counting H1N1 deaths see When No Number Is Right.


This report from KCCI-TV Channel 8,  Des Moines.


Polk Coroner: H1N1 Deaths Understated

Medical Examiner Says He's Autopsied Undiagnosed Patients

POSTED: 8:31 pm CST November 19, 2009
 

DES MOINES, Iowa -- Iowa has officially recorded 21 H1N1 deaths, including seven in Polk County alone. But the county's medical examiner said he has performed autopsies on some residents who were never diagnosed with H1N1, but actually had it.


"In the autopsy, what we're seeing is very heavy, wet hemorrhagic lungs, lungs with a lot of blood in them," said Dr. Gregory Schmunk.


He said the official count of seven H1N1 deaths is inaccurate, but patient rights laws prohibit him from giving specific numbers.


He said there are two reasons for the discrepancy. First, not all sick patients get tests and second, the virus is difficult to detect. Some patients may be too sick to receive the most accurate H1N1 test.


"They're not always done and it can be hazardous to the patient if they're in a respiratory critical situation," Schmunk said.


He also said that some tests reveal a false negative.


"Because of our limitations on testing, sometimes the tests aren't positive," he said. "They do appear to fit clinically the course of a H1N1 viral-type pneumonia."


He said the cases he's seen in Polk County were all middle-aged adults with a few underlying health conditions.


(Continue . . . )

Wednesday, November 11, 2009

Recalculating The H1N1 Death Toll


# 3988


This is something we’ve discussed many times before, most recently last Saturday with When No Number Is Right.  


It is impossible to accurately `count’ flu deaths in this country.   We don’t count them during a normal flu season, and we certainly can’t count them during a pandemic.


The often parroted number of `36,000' flu deaths annually’ in the United States isn’t the result of a count – it is the result of an averaging of estimated annual excess deaths during flu season over nearly a decade. 


That range of estimated excess deaths ran from 17,000 to 52,000. 


Here is how the CDC describes the process.

How did CDC estimate that an average of 36,000 people die in the U.S. each year from seasonal flu?

This statistic came from a 2003 JAMA study by CDC scientists [10]. The study used statistical modeling to estimate that during 9 influenza seasons from 1990-91 through 1998-99, an annual average of 36,000 flu-related deaths occurred among people whose underlying cause of death on their death certificate was listed as a respiratory or circulatory disease. A 2009 study that appeared in the journal Influenza and Other Respiratory Viruses made a similar estimate for the 10 influenza seasons from 1993 to 2003 [9].


These numbers are not without their critics, and in 2005 Peter Doshi published a challenge to these models in the BMJ  (doi:10.1136/ bmj.331.7529.1412) where he argued that the 36,000 deaths a year is badly overstated.


On Saturday, I alluded to the fact that the CDC was working on new estimates of infections, hospitalizations, and deaths  . . . and we ought to be hearing about those in the next few weeks. 


These won’t be `count's’ of course, they will be estimates, and they will involve likely ranges.   But they should give us a better idea of the impact of the H1N1 virus.


Donald G. McNeil Jr, of the New York Times picks up the story with word that those estimates are under review, and should be released in the next week or two.


Recalculating the Tally in Swine Flu Deaths

By DONALD G. McNEIL Jr.

Published: November 10, 2009

About 4,000 Americansrather than about 1,200 — have died of swine flu since the disease emerged in April, according to new figures being calculated by epidemiologists for the Centers for Disease Control and Prevention.


The larger number of deaths does not mean the virus is more dangerous. Rather, it is a new estimate made by combining deaths from laboratory-confirmed cases of the flu and deaths that appear to be brought on by flu, even though the patient may have ultimately died of bacterial pneumonia, other infections or organ failure.


The new estimate of deaths — actually a range both larger and smaller than 4,000 — will not be released until sometime next week because the centers’ consultants are still looking over the figures, said Glen Nowak, a C.D.C. spokesman.


The new estimate will be a more accurate comparison to the 36,000 deaths from seasonal flu each year, he said. That estimate is also based on confirmed cases as well as hospital reports of people who appear to have died after a bout of flu. Over 90 percent of seasonal flu victims are over 65, and many are bedridden or in nursing homes or have serious medical problems like cancer or heart disease that the flu worsens.


The new estimate “does sound much more reasonable,” said Ira M. Longini Jr., a flu epidemiologist at the University of Washington. “It doesn’t surprise me that it’s higher.”


(Continue . . . )


For more perspective on the difficulties involved in determining the actual number of H1N1 deaths – or even the death toll from seasonal flu - you may wish to check these blogs from the past 6 months.


When No Number Is Right
Numbers Don’t Tell The Whole Story
Apples, Oranges, And Influenza Death Tolls
Measuring The Severity Of A Pandemic