Showing posts with label Mortality. Show all posts

Friday, January 25, 2013

CDC FluView Week 3


 image


# 6882


The FluView report for week three is out, and the news includes eight pediatric deaths and the continued spike in P&I mortality rates (Pneumonia & Influenza) as reported by 122 U.S. Cities, which reached 9.8%.

image


P&I mortality is typically a trailing indicator of the flu season, and so while some regions are seeing decreases in influenza activity, the number of deaths can continue to rise for several weeks.


Some highlights from this week’s report:


2012-2013 Influenza Season Week 3 ending January 19, 2013

All data are preliminary and may change as more reports are received.

Synopsis:

During week 3 (January 13-19), influenza activity remained elevated in the United States, but decreased in some areas.

  • Viral Surveillance: Of 11,984 specimens tested and reported by collaborating laboratories, 3,129 (26.1%) were positive for influenza.
  • Pneumonia and Influenza Mortality: The proportion of deaths attributed to pneumonia and influenza (P&I) was above the epidemic threshold.
  • Influenza-Associated Pediatric Deaths: Eight influenza-associated pediatric deaths were reported.
  • Influenza-Associated Hospitalizations: A cumulative rate for the season of 22.2 laboratory-confirmed influenza-associated hospitalizations per 100,000 population was reported. Of all hospitalizations, 50% were among adults 65 years and older.
  • Outpatient Illness Surveillance: The proportion of outpatient visits for influenza-like illness (ILI) was 4.3%; this is above the national baseline of 2.2%. All 10 regions reported ILI above region-specific baseline levels. Twenty-six states and New York City experienced high ILI activity; 14 states experienced moderate activity; 9 states experienced low activity; 1 state experienced minimal activity, and the District of Columbia had insufficient data.
  • Geographic Spread of Influenza: Forty-seven states reported widespread geographic influenza activity; 2 states reported regional activity; the District of Columbia and one state reported local activity; Guam reported sporadic influenza activity, and Puerto Rico and the U.S. Virgin Islands did not report.


The eight pediatric deaths did not all occur during the reporting week, as the following summary explains.


Influenza-Associated Pediatric Mortality:

Eight influenza-associated pediatric deaths were reported to CDC during week 3. Two were associated with influenza A viruses for which the subtype was not determined and occurred during week 1 (week ending January 5, 2013), and six were associated with influenza B viruses and occurred during weeks 43, 46, 50, 52, and 3 (weeks ending October 27, November 17, December 15 and 29, 2012 and January 19, 2013).


A total of 37 influenza-associated pediatric deaths have been reported during the 2012-2013 season from New York City [1] and 18 states (Arkansas [1], Colorado [4], Florida [4], Indiana [1], Kansas [1], Maine [1], Massachusetts [1], Michigan [4], Minnesota [1], Nebraska [1], New Jersey [2], New York [3], Ohio [1], South Carolina [1], Tennessee [1], Texas [7], Washington [1], and Wisconsin [1]). Additional data can be found at http://gis.cdc.gov/GRASP/Fluview/PedFluDeath.html.


The age group most impacted by this year’s flu season continues to be those over the age of 65, who account for half of all those hospitalized.


image


The last time the CDC charted P&I 122 City Mortality Rates this high was in Dec-Jan of the 2003-04 flu season (see chart below) – that like this one – began early and has been categorized as `moderately severe’ by the CDC (cite 2003 - 04 U.S. INFLUENZA SEASON SUMMARY*)


image

2003-04 Flu Season P&I Mortality

As a historical note, the P&I mortality rate reached 11% across 122 cities during the 3rd week of January, 2000.

image

So while elevated, this week’s P&I mortality rate is not unprecedented.


Last week, CDC Director Frieden pointed out the heavy toll this flu season is having on the elderly (see CDC Media Briefing), and stressed the importance of early treatment with Tamiflu (oseltamivir) for high risk patients

Wednesday, January 02, 2013

JAMA: BMI And All Cause Mortality

image

Photo Credit CDC PHIL


# 6816


*** UPDATED ***

This study, which I knew would be controversial, has sparked serious rebukes from some members of the medical community. In the Interest of fairness, here is a link to an article from BBC News, where a number of doctors take issue with its findings.


'Weight is healthy' study criticised

A study which suggests being overweight can lead to a longer life has caused controversy among obesity experts.

(Continue . . . )

************************


As someone who has been `gravitationally challenged’ nearly all of his life, I naturally have concerns that my extra poundage may be cutting into my lifespan.


While aesthetically, thinner may be perceived by many as being better, increasingly we are seeing evidence to suggest that carrying a few extra pounds may actually extend one’s lifespan, not shorten it.


Last October, in Studies Weigh In On The `Obesity Paradox’, we looked at research that suggested that for people with certain medical conditions, including diabetes, congestive heart failure, kidney dialysis, heart attacks, and Asthma - carrying some extra weight appears to improve their outcomes


Now, in a study published in JAMA, we have the most comprehensive look to date at all-cause mortality spanning nearly 3 million people (and 270,000 deaths), and sorted by BMI (Body Mass Index) classification.


image

Photo Credit JAMA Report Video


The results, consistent across all ages and ethnic groups, indicated that while BMI’s over 35 (Class 2 and Class 3 obesity) increase overall mortality, that simply being overweight (BMI 25-<30) was associated with a significant reduction in all-cause mortality.


And even those who fell into the next higher BMI category (class 1 obesity) saw a 5% reduction in overall mortality compared to those falling into the normal weight BMI (18.5-<25).


Mortality rates do jump considerably once you reach a BMI > 35 ( resulting in a 29% increased risk of death for obesity grades 2 and 3). The HHS maintains an online BMI calculator HERE, where you can input your height and weight and quickly find out your number.


The JAMA article, which is heavy in statistics and details, is freely available at the following link.


Association of All-Cause Mortality With Overweight and Obesity Using Standard Body Mass Index Categories: A Systematic Review and Meta-analysis

Katherine M. Flegal, PhD; Brian K. Kit, MD; Heather Orpana, PhD; Barry I. Graubard, PhD

Conclusions and Relevance  Relative to normal weight, both obesity (all grades) and grades 2 and 3 obesity were associated with significantly higher all-cause mortality. Grade 1 obesity overall was not associated with higher mortality, and overweight was associated with significantly lower all-cause mortality. The use of predefined standard BMI groupings can facilitate between-study comparisons.


Several brief videos, and press release (excerpts below) can be viewed at:


Higher Levels of Obesity Associated With Increased Risk of Death; Being Overweight Associated With Lower Risk of Death

EMBARGOED FOR RELEASE: 3 P.M. (CT) TUESDAY, JANUARY 1, 2013

CHICAGO – In an analysis of nearly 100 studies that included approximately 3 million adults, relative to normal weight, overall obesity (combining all grades) and higher levels of obesity were both associated with a significantly higher all-cause risk of death, while overweight was associated with significantly lower all-cause mortality, according to a study in the January 2 issue of JAMA.


“Estimates of the relative mortality risks associated with normal weight, overweight, and obesity may help to inform decision making in the clinical setting,” according to background information in the article.


Katherine M. Flegal, Ph.D., of the National Center for Health Statistics, Centers for Disease Control and Prevention, Hyattsville, Md., and colleagues conducted a study to compile and summarize published analyses of body mass index (BMI) and all-cause mortality that provide hazard ratios (HRs) for standard BMI categories. For the review and meta-analysis, the researchers identified 97 studies that met inclusion criteria, which provided a combined sample size of more than 2.88 million individuals and more than 270,000 deaths. Regions of origin of participants included the United States or Canada (n = 41 studies), Europe (n = 37), Australia (n = 7), China or Taiwan (n = 4), Japan (n = 2), Brazil (n = 2), Israel (n = 2), India (n = l), and Mexico (n = l).


All-cause mortality HRs for overweight (BMI of 25-<30), obesity (BMI of ≥30), grade 1 obesity (BMI of 30-<35), and grades 2 and 3 obesity (BMI of ≥35) were calculated relative to normal weight (BMI of 18.5-<25).


The researchers found that the summary HRs indicated a 6 percent lower risk of death for overweight; a 18 percent higher risk of death for obesity (all grades); a 5 percent lower risk of death for grade 1 obesity; and a 29 percent increased risk of death for grades 2 and 3 obesity.


The authors note that the finding that grade 1 obesity was not associated with higher mortality suggests that that the excess mortality in obesity may predominantly be due to elevated mortality at higher BMI levels.

(Continue . . . )


In an accompanying editorial, Does Body Mass Index Adequately Convey a Patient’s Mortality Risk?, authors Steven B. Heymsfield, MD and William T. Cefalu, MD write:


The presence of a wasting disease, heart disease, diabetes, renal dialysis, or older age are all associated with an inverse relationship between BMI and mortality rate, an observation termed the obesity paradox or reverse epidemiology. The optimal BMI linked with lowest mortality in patients with chronic disease may be within the overweight and obesity range. Even in the absence of chronic disease, small excess amounts of adipose tissue may provide needed energy reserves during acute catabolic illnesses, have beneficial mechanical effects with some types of traumatic injuries, and convey other salutary effects that need to be investigated in light of the studies by Flegal et al and others.”


“Not all patients classified as being overweight or having grade 1 obesity, particularly those with chronic diseases, can be assumed to require weight loss treatment. Establishing BMI is only the first step toward a more comprehensive risk evaluation.”


While I can think of many other disadvantages to being overweight (my dreaded fear of wicker furniture being one), it appears that at least in terms of overall mortality - carrying a few extra pounds may actually turn out to be desirable - particularly among those who have chronic ailments.

Thursday, December 13, 2012

BMC: Exploring The `Age Shift’ Of Pandemic Mortality


image

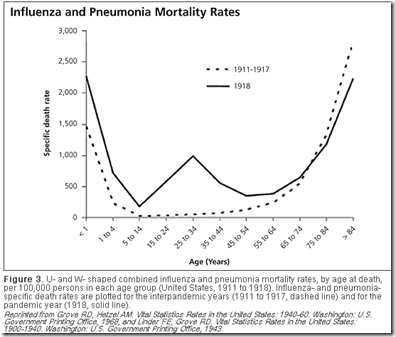
The infamous `W shaped curve’ of the 1918 pandemic clearly shows that the death rates among those in their teens, 20s, and 30s was much higher than was normally seen in previous influenza years. Those over the age of 65, however, saw a reduction in mortality during the pandemic.


# 6778


Seasonal influenza can strike people of any age, but exacts its greatest toll on the elderly – those over the age of 65 whose weaker immune systems (and comorbid conditions) often render them less able to fight off the infection.


Exact numbers remain elusive, since influenza is only rarely cited as the primary cause of death. If a cause of death (beyond`natural causes’) is given, comorbidities like COPD, heart disease, asthma are far more likely to listed on a death certificate.


Still, estimates are that 90% of seasonal flu mortality occurs in those over the age of 65 (cite CDC Pink book).


In 2010, (see Study: Years Of Life Lost Due To 2009 Pandemic), researchers estimated the median age of death due to seasonal influenza-related illness in the United States to be 76.


In contrast, pandemic influenza strains, at least during the first few years after their introduction, often produce a dramatic `age shift’ downward in mortality. 


The CDC’s estimate of average and median age of death due to the 2009 Pandemic virus reads:


Based on two CDC investigations of confirmed 2009 H1N1-related deaths that occurred during the spring and fall of 2009, the average age of people in the U.S. who died from 2009 H1N1 from April to July of 2009 was 40. The median age of death for this time period was 43. From September to October of 2009, the average age of people in the U.S. who died from 2009 H1N1 was 41, and the median age was 45.


Admittedly, younger fatalities are more likely to be investigated, and documented, than those that occur among the elderly, but still . . . this is a significant shift.


And it corresponds closely to the results of the Years Of Life Lost Study mentioned above, which found the mean age of death from the novel H1N1 virus to be half that of seasonal flu, or 37.4 years.


In terms of years of life lost (YLL), the average pandemic flu death has a many fold greater impact than the average seasonal flu fatality.   


This same pattern was repeated (to greater and lesser degrees) during the 1918, 1957, and 1968 pandemics  . . .  along with the 1977 return of the H1N1 virus after an absence of 20 years.


All of which has led to a good deal of speculation.


What drives this age shift?  Why were apparently healthy, younger flu victims, with robust immune systems more likely to die from pandemic flu?


Although not universally accepted, one popular theory has centered around the production of a `cytokine storm’, which is believed to be the product of a robust immune system typically found in younger, healthier individuals.


Cytokines are a category of signaling molecules that are used extensively in cellular communication. They are often released by immune cells that have encountered a pathogen, and are designed to alert and activate other immune cells to join in the fight against the invading pathogen.


This cascade of immune cells rushing to the site of infection, that if it races out of control, can literally kill the patient.


The patient’s lungs can fill with fluid (which makes a terrific medium for a bacterial co-infection), and cells in the lungs (Type 1 & Type II Pneumocytes) can sustain severe damage.


You can find more on this theory in these earlier posts:


Study: Calming The Cytokine Storm
Cytokine Storm Warnings

The Baskin Influenza Pathogenesis Study

Pt. 1               Pt. 2            Pt. 3


Another theory has held that older populations are more likely to have been exposed to a similar influenza strain in the past and are more likely to carry some level of immunity to the emerging pandemic strain.


This was clearly the case in 1977, when the H1N1 virus – supplanted by the H2N2 virus in 1957 – made an unexpected comeback.  Those born after the virus last circulated in the mid 1950s – were the hardest hit age group.


Again with the 2009 H1N1 pandemic virus, those born before the early 1950s appeared to have higher levels of immunity, resulting in fewer severe outcomes among older individuals.


All of which serves as prelude to a research article, published yesterday in BMC Medicine, that looks at the age shift during pandemic outbreaks.


The age distribution of mortality due to influenza: pandemic and peri-pandemic

Tom Reichert, Gerardo Chowell and Jonathan A McCullers

Background

Pandemic influenza is said to 'shift mortality' to younger age groups; but also to spare a subpopulation of the elderly population. Does one of these effects dominate? Might this have important ramifications?

Methods

We estimated age-specific excess mortality rates for all-years for which data were available in the 20th century for Australia, Canada, France, Japan, the UK, and the USA for people older than 44 years of age. We modeled variation with age, and standardized estimates to allow direct comparison across age groups and countries. Attack rate data for four pandemics were assembled.

Results

For nearly all seasons, an exponential model characterized mortality data extremely well; For seasons of emergence and a variable number of seasons following, however, a subpopulation above a threshold age invariably enjoyed reduced mortality. 'Immune escape', a stepwise increase in mortality among the oldest elderly, was observed a number of seasons after both the A(H2N2) and A(H3N2) pandemics. The number of seasons from emergence to escape varied by country. For the latter pandemic, mortality rates in four countries increased for younger age groups but only in the season following that of emergence. Adaptation to both emergent viruses was apparent as a progressive decrease in mortality rates, which, with two exceptions, was seen only in younger age groups. Pandemic attack rate variation with age was estimated to be similar across four pandemics with very different mortality impact.

Conclusions

In all influenza pandemics of the 20th century, emergent viruses resembled those that had circulated previously within the lifespan of then-living people. Such individuals were relatively immune to the emergent strain, but this immunity waned with mutation of the emergent virus. An immune subpopulation complicates and may invalidate vaccine trials. Pandemic influenza does not 'shift' mortality to younger age groups; rather, the mortality level is reset by the virulence of the emerging virus and is moderated by immunity of past experience. In this study, we found that after immune escape, older age groups showed no further mortality reduction, despite their being the principal target of conventional influenza vaccines. Vaccines incorporating variants of pandemic viruses seem to provide little benefit to those previously immune. If attack rates truly are similar across pandemics, it must be the case that immunity to the pandemic virus does not prevent infection, but only mitigates the consequences.

The complete article is available as a provisional PDF.


The entire article is worthy of your attention, and the authors delve into a good many areas, including future pandemic mitigation planning, and vaccine strategies. 


But essentially the authors propose that all recent influenza pandemics (over the past century) have involved `recycled’ flu strains to which some portion of the population had previously been exposed to.


They conclude:


Pandemics do not ‘shift’ mortality to younger ages

From this study, it is evident that pandemics do not ‘shift’ mortality to younger ages. Rather, the
entire mortality level is simply reset to the virulence level of the emergent virus. This reset is accompanied by immunoprotection in older age groups, which is determined by their level of previous experience with viruses similar to that emerging. 


In other words, were older populations not carrying some vestiges of immunity from previously flu encounters, these researchers suggest they would suffer the same levels (or higher) of mortality and morbidity as do younger populations.


The authors also point out that initial levels of immunity to emerging (or more properly, re-emerging) influenza viruses in older populations tends to wane in subsequent seasons, leading to what they call Immune Escape: `a stepwise increase in mortality among the oldest elderly’.


Does this blow the whole cytokine storm theory out of the water?


Not necessarily, although it does call into question just how much of an impact it has on the perceived `age shift’ in pandemic flu cases.


These two theories need not be mutually exclusive, however, and so I wouldn’t rule out the possibility that both may play a part in driving pandemic mortality demographics.

Monday, October 22, 2012

Studies Weigh In On The `Obesity Paradox’


image

Photo Credit CDC PHIL


# 6651


While just about everyone will concede that being lean and athletic is preferable to being soft and pudgy, there is a growing body of evidence that – with some medical conditions, at least - having a bit of extra poundage could be beneficial to your long-term survival. 


Research has shown that patients having a BMI > 30 actually are more likely to survive certain medical conditions than patients with a normal or below-normal body mass index.


It’s called the `Obesity Paradox’, and quite frankly, it’s been driving doctors and researchers just a little bit nuts for years.  


Now, before anyone cries `foul’, there are plenty of health risks that come from being obese, including diabetes, coronary artery disease, sleep apena, hypertension, and stroke. The point here isn’t that being overweight is healthier.


it isn’t.


But for people with certain medical conditions, including diabetes, congestive heart failure, kidney dialysis, heart attacks, and Asthma - carrying extra pounds appears to improve their outcomes.


This curious (and controversial) finding was first described in the literature in 1999, regarding survival rates of patients on kidney dialysis (see Influence of excess weight on mortality and hospital stay in 1346 hemodialysis patients). 


Since then, this phenomenon has inspired a good deal of research, much of it coming to similar conclusions.


Overnight we saw this press release come from the American College of Chest Physicians.


'Obesity paradox': Extra weight linked to better outcomes for septic shock, asthma exacerbation

Although obesity is linked to a variety of health risks, new research indicates that obese patients may have an advantage over nonobese patients in certain health situations, including septic shock and acute asthma exacerbation.


In two separate studies presented at CHEST 2012, the annual meeting of the American College of Chest Physicians, researchers compared outcomes in obese (BMI >30) vs nonobese patients with either septic shock or acute asthma exacerbation. Results showed that, although obese patients with asthma are more at risk for asthma exacerbations, near fatal exacerbations were more prevalent in nonobese patients.


Likewise, obese patients with septic shock had decreased mortality compared with nonobese patients. Researchers attribute this "obesity paradox" partly to a blunted pro-inflammatory cytokine response in obese patients.


Recently,  JAMA published a pooled analysis of 5 cohort studies that found – surprisingly – that : “Adults who were normal weight at the time of incident diabetes had higher mortality than adults who are overweight or obese.”

Original Contribution | August 8, 2012

Association of Weight Status With Mortality in Adults With Incident Diabetes

Mercedes R. Carnethon, PhD; Peter John D. De Chavez, MS; Mary L. Biggs, PhD; Cora E. Lewis, MD; James S. Pankow, PhD; Alain G. Bertoni, MD, MS; Sherita H. Golden, MD, MS; Kiang Liu, PhD; Kenneth J. Mukamal, MD, MPH; Brenda Campbell-Jenkins, PhD; Alan R. Dyer, PhD

JAMA. 2012;308(6):581-590. doi:10.1001/jama.2012.9282.


We’ve another large study out of Sweden that looked at patient outcomes with acute coronary syndromes (ACSs)  – and you guessed it – obese patients had better survival rates after a heart attack than patients of normal weight.


Evidence for obesity paradox in patients with acute coronary syndromes: a report from the Swedish Coronary Angiography and Angioplasty Registry

Oskar Angerås, Per Albertsson, Kristjan Karason, Truls Råmunddal, Göran Matejka, Stefan James, Bo Lagerqvist, Annika Rosengren and Elmir Omerovic

Conclusion In this large and unselected group of patients with ACSs, the relation between BMI and mortality was U-shaped, with the nadir among overweight or obese patients and underweight and normal-weight patients having the highest risk. These data strengthen the concept of the obesity paradox substantially.


Similarly, from the American Journal of Cardiology, we get this study from earlier this summer, on survival rates of patients with congestive heart failure.


Volume 110, Issue 1 , Pages 77-82, 1 July 2012

The Obesity Paradox in Men Versus Women With Systolic Heart Failure

Adrienne L. Clark, BA, Jennifer Chyu, Tamara B. Horwich, MD, MS

Abstract (excerpt):

In multivariate analyses, normal BMI and normal WC were associated with higher relative risk for the primary outcome in men (BMI 1.34, WC 2.02) and women (BMI 1.38, WC 2.99). In conclusion, in patients with advanced HF, high BMI and WC were associated with improved outcomes in both genders. Further investigation of the interaction between body composition and gender in HF outcomes is warranted.


Admittedly, many of these medical conditions may well have been brought on by the patient’s obesity to start with, so none of these results should be construed as a green light for binge eating brownies.


As to why obese individuals may fare better with certain medical conditions that those of normal, or below normal, weight?  


There are plenty of theories.


  • It has been suggested that heavier patients may develop medical conditions earlier, may get more aggressive treatment, and thereby have a survival advantage.
  • Some theorize that hospitalizations and chronic illnesses – which often induce weight loss - put those without fat reserves at a disadvantage.
  • There is even speculation that adipose tissue may secrete protective cytokines and hormones (cite).


The truth is, no one really knows.


Finally, in 2005 epidemiologist Katherine Flegal published a study called Excess deaths associated with underweight, overweight, and obesity that looked at data from two decades of NHANES surveys, and found that mortality among those slightly overweight (BMI 25 -29) was less than those in the `normal’ weight category (BMI 20 -25).


This study found that it was really the extremes of being over or underweight that contributed to higher mortality.


Personally, I’m not sure what conclusions we can draw from all of this, but it is certainly food for thought.

Wednesday, August 29, 2012

Study: Kids, Underlying Conditions, And The 2009 Pandemic Flu

image

Credit CDC FluView


# 6522


The chart above illustrates the sharp rise in pediatric deaths from flu-related complications during the 2009-2010 H1N1 pandemic seasons in the United States.  As grim as this charts is, it probably doesn’t fully represent the burden the 2009 pandemic placed on the pediatric community.


In another chart, again from the CDC, we get an estimate of deaths related to the 2009 pandemic, broken down by age groups through April of 2010.


image


While just over 300 pediatric deaths were recorded during this time period, the CDC estimates that 4 times (n=1280) that many children likely died from flu-related illness in the United States.


Globally, the number was undoubtedly many times higher than that (see Lancet: Estimating Global 2009 Pandemic Mortality).


All of which serves as prelude to a new study that appears today in the journal  Pediatrics, that looks at 336 documented pH1N1-associated deaths, and finds a high number of kids with underlying neurologic conditions.


Two-thirds of all deaths in children under the age of 17 occurred in kids with at least 1 underlying medical condition (n=227), and just under half of all cases (n=146) involved neurological disorders, such as cerebral palsy, epilepsy, or intellectual disability.


Neurologic Disorders Among Pediatric Deaths Associated With the 2009 Pandemic Influenza

Lenee Blanton, MPHa,Georgina Peacock, MD, MPH, FAAPb, Chad Cox, MD, MPHa, Michael Jhung, MD, MPHa, Lyn Finelli, DrPHa, and Cynthia Moore, MD, PhDb

ABSTRACT (Excerpts)

RESULTS: Of 336 pH1N1-associated pediatric deaths with information on underlying conditions, 227 (68%) children had at least 1 underlying condition that conferred an increased risk of complications of influenza. Neurologic disorders were most frequently reported (146 of 227 [64%]), and, of those disorders, neurodevelopmental disorders such as cerebral palsy and intellectual disability were most common.

CONCLUSIONS: Neurologic disorders were reported in nearly two-thirds of pH1N1-associated pediatric deaths with an underlying medical condition. Because of the potential for severe outcomes, children with underlying neurologic disorders should receive influenza vaccine and be treated early and aggressively if they develop influenza-like illness.


According to a statement released last night by the CDC:


Of the children with neurologic disorders for whom information on vaccination status was available, only 21 (23 percent) had received the seasonal influenza vaccine and 2 (3 percent) were fully vaccinated for 2009 H1N1.


With September just around the corner, the annual push for flu vaccinations is upon us, and today’s study will hopefully help inspire parents to get all kids – regardless of underlying conditions - vaccinated against influenza.


While the effectiveness of flu vaccines vary from year-to-year, and indeed, from one person to the next, they remain the single most important preventative step you can take to avoid getting the flu each year.


Despite the hyperbolic anti-vaccine rhetoric often found on the Internet, the truth is, serious adverse reactions to the vaccine are exceedingly rare (see the CDC’s  Influenza Vaccine Safety).


With two new strains of seasonal flu expected to be in circulation this winter (Yamagata B, and the Victoria H3N2) ones that will be covered by this year’s vaccine – getting the flu shot this year is doubly important.


CDC recommends that just about everyone aged 6 months and older get an annual influenza vaccination, and stresses their importance for those who are at greater risk of serious complications.


For more on vaccine safety and effectiveness, the CDC maintains extensive web pages, and resources, on seasonal flu vaccines, including:


What You Should Know for the 2012-2013 Influenza Season


Preventing Seasonal Flu With Vaccination


Children, the Flu, and the Flu Vaccine

Tuesday, June 26, 2012

Lancet: Estimating Global 2009 Pandemic Mortality


# 6505


Sounding a bit like a broken record, during the first 12 months of the 2009 pandemic I wrote repeatedly on our inability to accurate count – or even estimate – the number of H1N1 flu deaths in the United States and around the globe.


Just a few of those posts include:


Dead Reckoning
The Tip Of The Iceberg
When No Number Is Right
Apples, Oranges, And Influenza Death Tolls


The CFR, or case fatality ratio is generally seen as the most important statistic in any pandemic, and yet it is often the hardest to quantify. This number is the percentage of people who, once infected, die (either directly or indirectly) as a result of that infection.


While that may seem a simple enough task , the truth is that even during a `normal’ flu season the CDC can only estimate the number of deaths in the United States related to influenza.


The problem is, influenza can provoke or exacerbate many other medical problems. Influenza can obviously lead to pneumonia and death, but it has also been linked to heart attacks, strokes (CVAs), and other potentially fatal health crises.


Most of the time, the attending doctor signs the death certificate and puts down the most immediate or obvious cause of death.  If influenza was a factor, it rarely is noticed or noted.


The official numbers we get from the CDC, the World Health Organization, and from individual countries are almost always referred to as `the tip of the iceberg’, or as in the graphic below, the tip of the pyramid.


surveillance


And this is the best we can do in developed countries, where the majority of people have at least some access to medical care and where governments make an attempt to maintain public health records and death registries.


For much of the rest of the world, these are luxuries that are too often unavailable.


As an example, in November of 2009, in Zhong Nanshan On China’s Death Toll, one of the real heroes of the 2003 SARS epidemic, openly questioned the low number of deaths being reported out of China.


The truth is, in many countries, no one was counting the dead. 


In South Africa, where nearly 1,000 AIDS/HIV deaths occur each day, no one was looking to see if flu was a factor.  No one had the time, and it simply wasn’t in the budget.  


The `official’ death toll, as reported by the World Health Organization was roughly 18,000 deaths globally,  but the WHO offered this disclaimer:


The reported number of fatal cases is an under representation of the actual numbers as many deaths are never tested or recognized as influenza related.World Health Organization.


Unfortunately, the mainstream media often reported the low official number of deaths without adequately explaining the acknowledged gaps in the data, leading many to believe that the 2009 pandemic was a damp squib.


The CDC stopped counting H1N1 influenza deaths in the summer of 2009, realizing that their official tally was more misleading that helpful.


In November of that year, they released their first estimate of the number of U.S. pandemic flu infections, hospitalizations, and deaths (see  CDC Releases Revised Hospitalization & Death Estimates), where they estimated that between about 2,500 and 6,000 2009 H1N1-related deaths occurred between April and October 17, 2009.


Two months later (see CDC Updates Estimates Of Infections, Hospitalizations, and Deaths From H1N1) the the CDC updated their estimates to carry through to the 12th of December. Their mid-range estimates were of 55 million infections and 11,160 deaths in the US from H1N1 since April of 2009.


Today, a study appears in The Lancet that attempts to estimate the number of global H1N1 deaths during the first year of the pandemic, and it comes up with a number than runs between 15 and 30 times higher than reported to the WHO.

Estimated global mortality associated with the first 12 months of 2009 pandemic influenza A H1N1 virus circulation: a modelling study

Dr Fatimah S Dawood MD , A Danielle Iuliano PhD, Carrie Reed DSc , Martin I Meltzer PhD , David K Shay MD, Po-Yung Cheng PhD, Don Bandaranayake MBBS , Robert F Breiman MD , W Abdullah Brooks MD , Philippe Buchy MD , Daniel R Feikin MD, Karen B Fowler DrPH , Aubree Gordon PhD , Nguyen Tran Hien MD , Peter Horby MBBSl, Q Sue Huang PhD , Mark A Katz MD , Anand Krishnan MBBS , Renu Lal PhD , Joel M Montgomery PhD , Kåre Mølbak MDo, Richard Pebody MBBS, Anne M Presanis PhD , Hugo Razuri MD , Anneke Steens MSc , Yeny O Tinoco DVM , Jacco Wallinga PhD , Hongjie Yu MDr, Sirenda Vong MD , Joseph Bresee MD , Dr Marc-Alain Widdowson VetMB

Findings

We estimate that globally there were 201 200 respiratory deaths (range 105 700—395 600) with an additional 83 300 cardiovascular deaths (46 000—179 900) associated with 2009 pandemic influenza A H1N1. 80% of the respiratory and cardiovascular deaths were in people younger than 65 years and 59% occurred in southeast Asia and Africa.


While most of this report is behind a pay wall, the CDC - which co-authored the study -  has posted a summary on their website.


CDC Releases First Global Estimates of 2009 H1N1 Pandemic Mortality

Photo: transparent globe representing the scope of the global estimates used in the CDC study of 2009 H1N1 pandemic mortality.

June 25, 2012 -- A study published today in The Lancet Infectious Diseases Online FirstExternal Web Site Icon provides the first global estimates of how many people died as a result of the 2009 H1N1 influenza pandemic. The study, co-authored by 9 members of the CDC Influenza Division, used an improved modeling approach which resulted in an estimated range of deaths from between 151,700 and 575,400 people who perished worldwide from 2009 H1N1 virus infection during the first year the virus circulated. A disproportionate number of deaths occurred in Southeast Asia and Africa, where access to prevention and treatment resources are more likely to be limited. Study authors hope that this work can be used not only to improve how influenza deaths are estimated, but also to improve the public health response during future pandemics in parts of the world that suffer more influenza-related deaths.


These global estimates are more than 15 times higher than the number of laboratory-confirmed deaths reported to the World Health Organization (WHO). WHO has acknowledged for some time that official, lab-confirmed reports are an underestimate of actual number of influenza deaths. Diagnostic specimens are not always collected from people who die with influenza; for others, influenza virus may not be detectable by the time of death. Because of these challenges, modeling is used to estimate the actual burden of disease.

<SNIP>

2009 H1N1 Pandemic Hits the Young Especially Hard

This study estimated that 80% of 2009 H1N1 deaths were in people younger than 65 years of age which differs from typical seasonal influenza epidemics during which 80-90% of deaths are estimated to occur in people 65 years of age and older. To illustrate the impact of the shift in the age distribution of influenza deaths to younger age groups during the pandemic, researchers calculated the number of years of life lost due to 2009 H1N1-associated deaths. They estimated that 3 times as many years of life were lost during the first year of 2009 H1N1 virus circulation than would have occurred for the same number of deaths during a typical influenza season.

(Continue . . . )


This age shift to younger victims was frequently noted during the pandemic, and in the spring of 2010 a study appeared that found that the mean age of death from the novel H1N1 virus has been calculated to be half that of seasonal flu, or 37.4 years.


In terms of years of life lost (YLL), the average pandemic flu death had a many fold greater impact than the average seasonal flu fatality – often robbing decades of potential life from its victims.


Preliminary Estimates of Mortality and Years of Life Lost Associated with the 2009 A/H1N1 Pandemic in the US and Comparison with Past Influenza Seasons

By Cecile Viboud, Mark Miller, Don Olson, Michael Osterholm et al (5 authors)


All of which makes the impact of the 2009 pandemic – in real terms – greater than most people realize.


Today’s new estimate is unlikely to be the last word on this subject. As more data is analyzed and new mathematical models are developed, better estimates will be generated.


We’ll never know the true number, of course.  Some things are not directly measureable. But having more accurate estimates can go a long ways towards helping us plan for the next pandemic.


And as most researchers acknowledge: that isn’t a matter of `if’, it’s just a matter of `when’.

Wednesday, October 19, 2011

UK: Pregnancy And Swine Flu


# 5909


There’s a report making a splash in the UK media today showing a link between increases in stillbirths and maternal deaths and infection with the 2009 H1N1 `swine’ flu.


This is a pattern we’ve seen with earlier pandemic flu viruses, although the exact reason behind it remains a mystery.


First, the story from the BBC on research conducted by the National Perinatal Epidemiology Unit at Oxford University, then I’ll return with more.


19 October 2011 Last updated at 02:46 ET

Study finds link between swine flu and stillbirth
By Dominic Hughes

Babies born to mothers who contracted the swine flu virus faced a much greater risk of being stillborn, according to a new study.


Baby deaths among women infected with the 2009 strain of the virus were five times higher than normal.


There was also a greater risk of premature births when compared to mothers who had not caught the virus.

(Continue . . . )


Noticeably absent from this report (and others in the media) is a link to the study, but this story appears to be based on a BMJ  open access study I wrote about last June.


Perinatal outcomes after maternal 2009/H1N1 infection: national cohort study

Matthias Pierce, Jennifer J Kurinczuk, Patsy Spark,Peter Brocklehurst, Marian Knight

Results Perinatal mortality was higher in infants born to infected women (10 deaths among 256 infants; rate 39 (95% confidence interval 19 to 71) per 1000 total births) than in infants of uninfected women (9 deaths among 1233 infants; rate 7 (3 to 13) per 1000 total births) (P<0.001). This was principally explained by an increase in the rate of stillbirth (27 per 1000 total births v 6 per 1000 total births; P=0.001). Infants of infected women were also more likely to be born prematurely than were infants of comparison women (adjusted odds ratio 4.0, 95% confidence interval 2.7 to 5.9). Infected women who delivered preterm were more likely to be infected in their third trimester (P=0.046), to have been admitted to an intensive care unit (P<0.001), and to have a secondary pneumonia (P=0.001) than were those who delivered at term.

Conclusions This study suggests an increase in the risk of poor outcomes of pregnancy in women infected with 2009/H1N1, which reinforces the message from studies of maternal risk alone. The health of pregnant women is an important public health priority in future waves of this and other influenza pandemics.


Even before the novel H1N1 virus emerged in the spring of 2009, pregnancy was considered to be a significant risk factor during an influenza pandemic.


Researchers saw during the 1918 Spanish Flu that an abnormally high number of pregnant women died, and those that survived endured a very high miscarriage rate.


Even during the much milder 1957 Asian Flu, pregnant women reportedly suffered disproportionately higher mortality rates than non-pregnant women of the same age (cite Rasmussen SA, Jamieson DJ, Bresee JS. Pandemic influenza and pregnant women. Emerg Infect Dis)


And very early into the 2009 H1N1 outbreak – even before the declaration of a pandemic by the World Health Organization – it became apparent that pregnant women were making up a disproportionate number of ICU admissions for influenza.


Less than a month after the outbreak was detected, the CDC’s MMWR published case studies of three pregnant women who had contracted novel H1N1.


Throughout the summer, pregnancy and flu was a major topic by public health officials around the world, with the WHO issuing a Pandemic Briefing # 5: Influenza In Pregnant Women in late July of 2009.


Since then, we’ve seen a number of studies on the impact of the H1N1 virus on pregnant women, including BMJ Study: Pregnancy & Flu – published in the spring of 2010.  


Although it was widely reported (see Pregnancy & Flu: A Bad Combination) during 2009 that pregnant women were up to 6 times more likely to be hospitalized with influenza than were non-pregnant women, this study found the risks of influenza death among pregnant women to be actually higher.


And while pandemic flu seems to be worse for pregnant women than seasonal flu, both can produce serious complications.


Which is why the CDC, and most other public health agencies around the world, continue to encourage seasonal flu vaccination – particularly for at risk groups – which includes pregnant women.


Pregnant Women Need a Flu Shot!

Photo: A woman with her healthcare professional.

Photo Credit – CDC

If you're pregnant, a flu shot is your best protection against serious illness from the flu. A flu shot can protect pregnant women, their unborn babies, and even their babies after birth.

(Continue . . .)


And as an added benefit, pregnant women who receive a flu shot can pass on important antibodies to their newborn infants – providing a degree of protection until they are old enough to receive the flu vaccine.


A study from Wake Forest Baptist Medical Center, that appeared earlier this year in American Journal of Obstetrics & Gynecology found that infants born to mothers who had received the flu vaccine during pregnancy were more than 45% less likely to be hospitalized with laboratory confirmed influenza.


For details on that research, you may wish to revisit Pssst! Immunity . . . Pass it On.


The bottom line is that influenza presents a serious health threat to both the mother, and to the child she carries, and that vaccination can help lower those risks.

Friday, September 16, 2011

MMWR: Influenza-Associated Pediatric Deaths 2010-2011


# 5844


The CDC’s MMWR yesterday contained an in-depth look at 115 flu-related pediatric deaths over the past 12 months (Sept 2010-Aug 2011). Notification of pediatric flu-related deaths has been nationally required since 2004.


Case criteria is defined as: `death from a clinically compatible illness confirmed to be influenza by a diagnostic test in a U.S. resident aged <18 years, with no period of complete recovery between illness and death’.


Despite being a reportable event, the number of flu-related pediatric deaths is likely under stated since only those patients who are tested for influenza, test positive, and then are subsequently reported to the CDC are counted.


Since reporting became mandatory, yearly pediatric influenza deaths have ranged from a low of 46 during the 2005-2006 flu season to a high of 282 during the 2009—2010 pandemic.


Making this past year’s total of 115 a bit higher than we’ve generally seen in a non-pandemic year.


FIGURE 1. Number of influenza-associated pediatric deaths (N = 115), by week of death and type of influenza virus --- United States, September 1, 2010--August 31, 2011

image


Despite surveillance numbers that showed that only 26% of the influenza viruses in circulation last year were influenza B, a disproportionately high 38% of these pediatric fatalities were attributed to the B virus.


Just under half (49%) of these pediatric deaths occurred in children who had no ACIP defined high risk medical conditions. These children also saw a shorter interval between illness onset and death (4 days versus 7 days), and were more likely to die at home or in the emergency department.


Statistics that reinforce the need for all parents to closely monitor their children when they have signs of influenza.  The CDC provides a parent’s guide with information on the danger signs in children, and advice on vaccination.


 image


Of the 57 cases that met at least one of ACIP’s high-risk definitions, the report lists: `31 (54%) had a neurologic disorder, 17 (30%) had pulmonary disease, 14 (25%) had a chromosomal abnormality or genetic disorder, 11 (19%) had congenital heart disease or other cardiac disease, and 11 (19%) had asthma or reactive airway disease. Obesity was reported in two (4%) of the 57 children’.


Vaccination coverage in this age cohort (6 mos – 17yrs) during the 2010-2011 flu season was estimated to be about 49%. 


Of the 74 children whose vaccination status could be established, only 23% had received influenza vaccine in at least 14 days before illness onset. Among children with at least one ACIP-defined high risk condition, 31% had been vaccinated.


Leading the authors to conclude:


These findings emphasize the need to improve vaccination coverage among all children, especially those at increased risk for influenza-related complications.

To protect infants aged <6 months who are too young to be vaccinated, ACIP recommends that pregnant women (3) and household contacts and out-of-home caregivers of such infants receive vaccination against influenza (1).

Because influenza vaccination of women during pregnancy has been shown to be effective in reducing hospitalizations (1) and deaths among infants aged <6 months (3), improving vaccination rates among pregnant women is a priority.


The complete and very detailed report may be viewed at:


Influenza-Associated Pediatric Deaths --- United States, September 2010--August 2011

Weekly

September 16, 2011 / 60(36);1233-1238


The editor’s summary states:


What is already known on this topic?

Since influenza-associated pediatric deaths became a nationally notifiable condition in 2004, the number of deaths reported to CDC has ranged from 46 during the 2005--06 influenza season to 282 during the 2009--10 season.


What is added by this report?

A total of 115 influenza-associated pediatric deaths were reported to CDC that occurred from September 1, 2010 to August 31, 2011. Fifty-six (49%) children who died from influenza virus infections during the 2010--11 influenza season had no reported Advisory Committee on Immunization Practices (ACIP)--defined high-risk medical conditions. Children without high-risk conditions had a shorter interval between illness onset and death (4 days versus 7 days), were more likely to die at home or in the emergency department, and were more likely to have a positive bacterial culture from a sterile site. Among children who died from influenza, few (23%) were vaccinated, and 50% received antiviral therapy.


What are the implications for public health practice?

Continued efforts are needed to ensure annual influenza vaccination in all persons aged ≥6 months, and children with high-risk medical conditions should be specially targeted for vaccination. Health-care providers should be aware that severe complications of influenza can occur in children without high-risk medical conditions. Early and aggressive treatment with oseltamivir or zanamivir is recommended as soon as possible after symptom onset in patients with confirmed or suspected influenza who are hospitalized; who have severe, complicated, or progressive illness; or who are at a higher risk for influenza complications.

Thursday, April 28, 2011

Study: Urban vs Rural Mortality From Spanish Flu


# 5528


The last `Great’ Influenza pandemic occurred in 1918-19, and while estimates vary widely, it may have claimed as many as 100 million lives.  A new strain of H1N1, it was known at the time as `Spanish Flu’.


The impact of this pandemic, however, varied greatly. In 2006, in a Lancet journal (doi:10.1016/S0140- 6736(06) 69895-4) article cited as much as a 30-fold difference in mortality rates around the world:


Estimation of potential global pandemic influenza mortality on the basis of vital registry data from the 1918—20 pandemic: a quantitative analysis

Christopher JL Murray , Alan D Lopez , Brian Chin , Dennis Feehan , Kenneth H Hill

Excess mortality ranged from 0·2% in Denmark to 4·4% in India. Since there was some under-registration of mortality in India, total pandemic mortality could have been even higher.


Indeed, in some the more remote regions of the world – such as among the Maori of New Zealand or the Eskimos of Alaska – the mortality rates were even higher.


The following account comes from Alaska’s pandemic history on http://1918.pandemicflu.gov/


In some areas, influenza decimated whole villages. A schoolteacher reported that in her immediate area “three [villages were] wiped out entirely, others average 85% deaths...Total number of deaths reported 750, probably 25% [of] this number froze to death before help arrived.”


One of the other striking features of the 1918 pandemic – aside from the high death toll – was the sparing of those over the age of 65 in the United States.


image

The infamous `W shaped curve’ of the 1918 pandemic clearly shows that the death rates among those in their teens, 20s, and 30s was much higher than was normally seen in previous influenza years.


This wide disparity in mortality rates – much of it based on anecdotal accounts – has long intrigued researchers.  Today we’ve a new study from the Norwegian Institute of Public Health that attempts to answer some of these questions.


What they found was that the mortality rate varied nearly 100 fold between remote, rural regions and urban populations, and that in the more remote areas, older persons were just as susceptible to the virus as those who were younger.


First excerpts from the Press release, then a link to the study.   I’ll return with some comments.


Large differences in mortality between urban and isolated rural areas

Published 27.04.2011 , updated: 27.04.2011, 12:30
Stikkord:


In urban communities, less than 1 in 100 inhabitants died from Spanish flu in 1918, but in isolated communities up to 9 out of 10 died. An important explanation for the differences is due to different exposure to influenza in the decades before the Spanish flu came. Those living in urban communities probably had a higher degree of pre-existing immunity that protected against illness and death in 1918 than those living in very isolated rural areas. This is shown in a new study from the Norwegian Institute of Public Health.


Previous studies have suggested that an important reason for the large regional differences in mortality must be that people living in cities were more frequently exposed to similar viruses to the one that caused the Spanish flu earlier in life than those living in rural and extremely isolated areas.


“It is not inconceivable that there was a different geographical spread of the virus in the 1800s and early 1900s, at a time when intercontinental communication networks were less developed" said Svenn-Erik Mamelund, a senior adviser in the Division of Infectious Disease Control at the Norwegian Institute of Public Health.


“No one knows exactly which influenza viruses circulated before 1918. But a leading theory is that there were H1-like viruses circulating in the period before the last major pandemic, the Russian pandemic of 1889-90. Some viruses circulating prior to 1889 may therefore have been related to the virus that caused the Spanish flu in 1918, A (H1N1). This would mean that some people who were older than 28-30 years in 1918 may have had some protection against severe infection and death from Spanish flu because of previous exposure to similar viruses," he said.

(Continue . . . )


This study appears in the Journal Epidemics.


Geography May Explain Adult Mortality from the 1918–20 Influenza Pandemic

Original Research Article
Pages 46-60
Svenn-Erik Mamelund


The theory that a similar H1 virus circulated prior to 1890 – and that provided some immunity to those over the age of 30 – is bolstered by this study.


Young people, and those older people living in isolation during the 1880s had not been exposed, and were therefore more vulnerable to the 1918 virus.


But as the author points out, that alone is not likely to have accounted for the huge difference in mortality.  From the abstract, the author writes:


Low exposure to H1-like viruses in adults could not alone explain the high total mortality in remote populations (up to 90%). A high concurrent disease load, crowding, low genetic variability, a lack of basic care, and infrequent exposure to other forms of influenza virus 1890–1917 may have played a role as well.


This form of immunological cross-protection from previous exposure to A-type influenza viruses other than H1N1 can only be explained as a consequence of cellular immunity against internal proteins that show less inter-strain variation than the surface proteins.


Our most recent pandemic experience, once again at the hands of the H1N1 virus, proved milder than feared probably for the same reasons.


As populations intermingle - we trade more viruses - and over time build up a certain level of immunity.  And part of that immunity may be generic cellular immunity, as opposed to antibodies to specific pathogens.


And in this highly mobile world, that may bode well for the next pandemic – assuming it comes from a relative of a virus that we’ve seen in the recent past; an H1, H2, or H3 strain.


There are no guarantees, of course.


Should a less familiar strain emerge, however, no one knows how severe an impact it might have.


The H5N1 virus has – thus far – killed about 50% of its known victims.  Far worse than the Spanish flu of 1918.  The H7 and H9 avian strains, however, have produced generally mild illness and few fatalities in humans.


So there is obviously more to the influenza mortality and morbidity story than just being immunologically naive to a virus. 


While today’s paper may not provide definitive answers to the questions surrounding the 1918 pandemic, it does give us more data to ponder and a plausible explanation for its divergent impact around the world.

Friday, January 22, 2010

Flu’s Double Whammy


# 4277


From the American Journal of Pathology today we get this study which uses a mouse model to explore the mechanisms that lead to an increased pathogenesis and mortality when bacterial pneumonia is immediately preceded by influenza.


The lead researcher describes what he suggests is a`lethal synergy between influenza virus and the bacterial respiratory pathogen, H. influenzae’. 


Their research indicates that influenza and bacterial pneumonia infections that - on their own would normally be non-lethal - grow in pathogenicity when the bacterial pneumonia directly follows an influenza infection.


Just over three weeks ago we saw this report, which correlates the higher pandemic mortality rates experienced in Argentina with bacterial pneumonias.


Study: Streptococcus Pneumoniae In Fatal H1N1 Cases In Argentina


And from 2008, we get these two studies from the CDC’s EID Journal.


EID Journal: Bacterial Pneumonia and Pandemic Planning
Study: Deaths From Bacterial Pneumonia During 1918-1919 Influenza Pandemic


One of our best defenses against these types of secondary infections are the child and adult pneumonia vaccines.  


CDC Promoting Better Uptake Of PPSV in Adults
PCV7 Pneumococcal Vaccine Would Save Lives In A Pandemic


Here is the press release on this latest study, followed by a link to the study’s abstract.


Contact: Angela Colmone, Ph.D.
acolmone@asip.org
301-634-7953
American Journal of Pathology

Double trouble: Bacterial super-infection after the flu

San Diego, CA – Current research suggests that the flu may predispose to secondary bacterial infections, which account for a significant proportion of mortality during flu pandemics. The related report by Lee et al, "A mouse model of lethal synergism between influenza virus and Haemophilus influenzae," appears in the February 2010 issue of The American Journal of Pathology.


Influenza affects between three and five million people annually, causing up to 500,000 deaths worldwide. While most people will recover in one to two weeks, others will develop life-threatening conditions such as pneumonia or bronchitis. High-risk groups for seasonal influenza include the very young and old, people with compromised immune systems, and pregnant women. However, during influenza pandemics, mortality may be significant in previously healthy young adults.


A common complication of flu infection is a secondary "super-infection" by bacteria, which greatly increases the morbidity and mortality of the disease. The most common bacterial agents found following flu pandemics have been Streptococcus pneumoniae, Haemophilus influenzae, Group A Streptococcus, and Staphylococcus aureus. Furthermore, reports of infection with antibiotic-resistant strains have been increasing in recent years.


To explore the mechanisms governing the increased pathogenesis of flu upon super-infection, a group led by Dr. Sally R. Sarawar of the Torrey Pines Institute for Molecular Studies, San Diego, California confirmed that otherwise nonlethal influenza and H. influenzae infections cause high mortality rates in mice when flu infection precedes H. influenzae infection. Their data confirm a restricted time period for this heightened susceptibility and highlight that excessive bacterial, and not viral, growth is associated with increased lethality. The fact that this increased mortality was observed in both immunocompromised and immunocompetent mice suggests that even normal healthy people are at increased risk for complications following bacterial super-infection.


Lee et al suggest that the "lethal synergy between influenza virus and the bacterial respiratory pathogen, H. influenzae, is mediated by innate immunity. They observed that severe damage to the airways was an early event in the co-infected mice, eventually leading to death. This underscores the need for early antiviral and antibiotic treatment to combat severe disease in human patients and highlights the importance of vaccination and effective hygiene measures to prevent secondary bacterial infections during influenza infection. This new model will be useful for further investigating the mechanisms underlying severe disease caused by the interaction between influenza virus and bacteria, which may have resulted in numerous deaths during influenza pandemics and continues to constitute a significant clinical problem in susceptible individuals." Currently ongoing studies suggest that this model may also be useful for identifying target molecules for the development of novel therapeutic agents and strategies.


Lee LN, Dias P, Han D, Yoon S, Shea A, Zakharov V, Parham D, Sarawar SR. A Mouse Model of Lethal Synergism Between Influenza Virus and Haemophilus influenzae. American Journal Of Pathology, 2009; DOI: 10.2353/ajpath.2010.090596