
The power of a CAT 5 Storm – Hurricane Andrew 1992
# 10,096
Today is day three of National Hurricane Preparedness Week, and the emphasis is on hurricane winds, the classic (although not always the best) gauge of a hurricane’s power.
Hurricanes are measured by the Saffir-Simpson Scale, which bases their strength on sustained wind speeds. Anything CAT 3 or higher is considered a major hurricane.

Even a CATEGORY 1 storm can spin up tornadoes, or produce wind gusts substantially stronger than their sustained wind speeds. Older Mobile homes, RVs, and even some conventionally built structures may not withstand a CAT 1 storm.
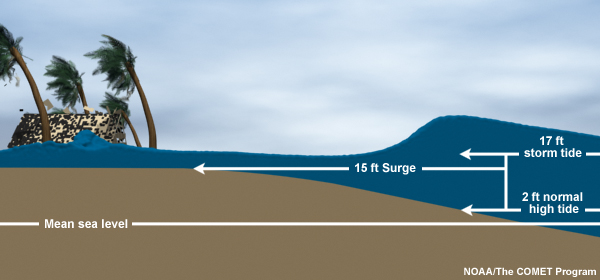
While storm surge is the greatest concern to those living in low-lying coastal areas, hurricane force winds can extend a hundred miles or more inland during a landfalling hurricane.
And while great strides have been made over the past few decades in forecasting the path (out to about 48-72 hrs) of hurricanes, meteorologists are far less able to predict intensity changes of these storms.
Just before landfall in 2004, Hurricane Charlie unexpectedly changed direction and ramped up from a moderate CAT 2 to storm to a major CAT 4 in just three hours, leaving coastal residents no time for evacuations.
If you live in vulnerable areas, you need to be aware of your evacuation zone, many of which have been recently revised due to a better understanding of storm surge, flooding, and wind damage risks.
Whether you stay, or leave, you’ll probably want to secure your home as best you can before high winds arrive. And this year emergency managers are once again reminding the public of the folly and futility of taping their windows in advance of a hurricane.
Up until the 1970s, it was pretty much standard advice to homeowners to tape plate glass windows to keep them from shattering, but that advice was discredited, and has not been part of hurricane prep advice for 30 years.
Not only does taping windows provide a false sense of security, it can bind shards of flying glass into larger, and more dangerous, projectiles.
Still, the myth hangs on.
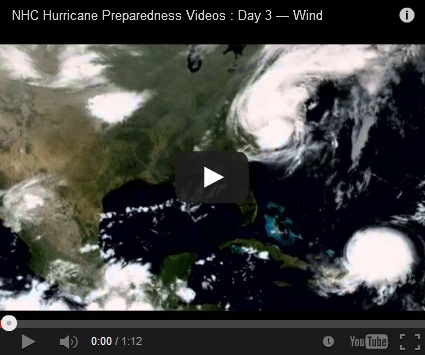
A video that I’ve highlighted in the past, from the Pinellas County Office of Emergency Management demonstrates just how useless masking, or duct taping your your windows really is during a storm .

And for more on this week’s Hurricane Preparedness campaign, visit the following NOAA website which features videos focusing on each day’s topic.

And for the first two blogs in this week’s series, you may wish to visit:


