Showing posts with label Storm. Show all posts

Monday, May 25, 2015

Storm Surge Monday – Hurricane Preparedness Week

 image

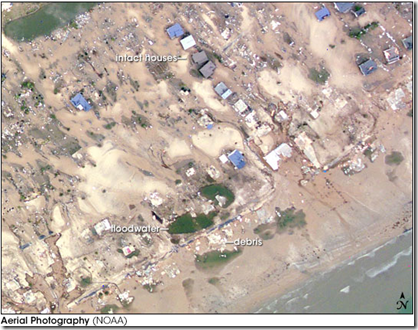
Crystal Beach, Tx after Hurricane Ike (2008) showing destructive force of storm surge

# 10,088


This is day two of 2015’s National Hurricane Preparedness Week and the focus today is on Storm Surge, often the biggest cause of death from these killer storms.  While we usually worry most about the winds surrounding the eye of a hurricane, storm surge is more dependent on the contour of the coast, the storm’s angle of approach, and the forward speed of the storm.


Often the highest surge is well away from where the eye crosses the coastline, which can catch some coastal residents off guard.


This year the National Hurricane Center will be introducing a new experimental forecast product designed to warn coastal residents of areas where dangerous storm surges are expected.   Full implementation of this product is not expected until 2017.


National Hurricane Center to issue storm surge watch and warning graphic

image


Beginning with the 2015 hurricane season, NOAA’s National Hurricane Center (NHC) will offer an experimental storm surge watch/warning graphic to highlight those areas along the Gulf and Atlantic coasts of the United States that have a significant risk of life-threatening inundation by storm surge from a tropical cyclone.


The new graphic is designed to introduce the concept of a watch or warning specific to the storm surge hazard. Storm surge is often the greatest threat to life and property from a tropical cyclone, and it can occur at different times and at different locations from a storm’s hazardous winds. In addition, while most coastal residents can remain in their homes and be safe from a tropical cyclone’s winds, evacuations are generally needed to keep people safe from storm surge. Having  separate warnings for these two hazards should provide emergency managers, the media, and the general public better guidance on the hazards they face when tropical cyclones threaten.

(Continue . . . )


Next  stop, a short video from the NHC (National Hurricane Center), and a NHC description of storm surge, after which I’ll return with a bit more:

image

Storm Surge vs. Storm Tide
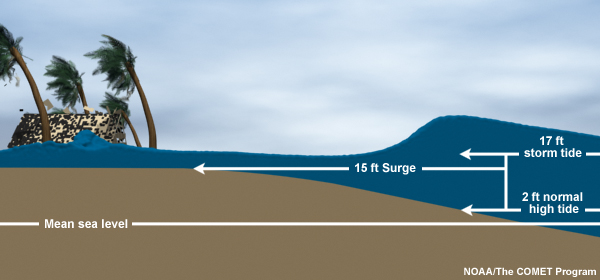
Storm surge is an abnormal rise of water generated by a storm, over and above the predicted astronomical tides. Storm surge should not be confused with storm tide, which is defined as the water level rise due to the combination of storm surge and the astronomical tide. This rise in water level can cause extreme flooding in coastal areas particularly when storm surge coincides with normal high tide, resulting in storm tides reaching up to 20 feet or more in some cases.


Storm Surge vs. Storm Tide


Back in 2011,  in Getting SLOSHed For Hurricane Season I wrote about the Sea, Lake and Overland Surges from Hurricanes computer model that emergency planners use to plan for coastal evacuations.  In order to know in advance how far inland a storm surge or tide will encroach, emergency planners run hundreds of SLOSH models for populated regions along the coast. 


image

They vary the size, intensity, direction, and forward speed of hurricanes in the model in order to determine the worst case impact for each category of storm. Evacuation maps and routes are then generated using this information.

image

This evacuation map of Pinellas County (St. Petersburg-Clearwater) Florida shows that a storm even as low as a CAT 3 could temporarily cut the southern half of the county off from the north.


Of course much depends upon the speed, direction, and point of landfall of the storm, and so not all CAT 3 storms impacting this area would produce this dramatic of an effect.


Take it from someone who has experienced more than one of these storm surges first hand . . . if you are asked to evacuate by your local authorities, don’t hesitate.


Just do it.


For more information on the storm’s effects, and how you should prepare, check back every day this week and visit:

image

Wednesday, July 23, 2014

NASA: The Solar Super Storm Of 2012

image

Credit NASA


# 8859


Although it sounds like science fiction, two years ago today the earth narrowly (by cosmic standards) missed being hit by a massive solar storm that had the potential to knock our technology-dependant society back a hundred years. 


Back in 2010 we looked at the granddaddy of all known solar storms, the Carrington Event of 1859, and have revisited the topic a number of times since then, including:


NASA: Solar Max Is Finally Here

Solar Storms, CMEs & FEMA

NASA Braces For Solar Disruptions


While this solar cycle has produced the weakest solar maximum in living memory, it also produced – on July 23rd, 2012 – the largest known solar flare in 155 years.  A double-whammy solar flare that rivaled, or perhaps even exceeded, the power of the 1859 Carrington event.


One that - had it erupted a week earlier – would have directly impacted earth.


A Solar Flare is the brief, sudden release of radiation energy (X-Ray, Gamma Rays, & energetic particles (protons and electrons)) from the surface of the sun, generally in the vicinity of an active sunspot.


Solar flares are rated as either C Class (minor), M Class (Moderate), or X Class (extreme), and while the electromagnetic radiation they release can reach earth in only about 8 minutes time, their effects are mostly limited to disrupting communications and potentially damaging satellites.


A CME (Coronal Mass Ejection) is the ejection of a massive amount of plasma (electrons and protons & small quantities of helium, oxygen, and iron) from the the sun that may last for hours. Some of this plasma falls back into the sun, but trillions of tons can escape and if aimed in their direction, impact surrounding planets.


A CME may arrive on earth – 93 millions miles distant from the sun – 48 to 72 hours after it is observed, and spark a Geomagnetic Storm.   


While they pose no direct physical danger to us on the earth’s surface (we are protected by the earths magnetic field and atmosphere), a large CME can wreak havoc with electronics, power generation, and radio communications.


All of which brings us to a report, and 4 minute video, from NASA on this second anniversary of the earth almost getting clobbered by a `Carrington class’ solar storm.  First the links, and excerpts, and then I’ll be back with more.


Near Miss: The Solar Superstorm of July 2012

July 23, 2014: If an asteroid big enough to knock modern civilization back to the 18th century appeared out of deep space and buzzed the Earth-Moon system, the near-miss would be instant worldwide headline news.

Two years ago, Earth experienced a close shave just as perilous, but most newspapers didn't mention it. The "impactor" was an extreme solar storm, the most powerful in as much as 150+ years.

"If it had hit, we would still be picking up the pieces," says Daniel Baker of the University of Colorado. 

splash

A ScienceCast video recounts the near-miss of a solar superstorm in July 2012. Play it

(Continue . . . )


From my perspective, that wasn’t a `near miss’ . . .  that was more of a `near hit’.


And even more sobering is this assessment, suggesting the odds of earth being struck by one of these solar super storms is actually a lot higher than we’ve previously thought.  Again from the NASA article:


In February 2014, physicist Pete Riley of Predictive Science Inc. published a paper in Space Weather entitled "On the probability of occurrence of extreme space weather events."  In it, he analyzed records of solar storms going back 50+ years.  By extrapolating the frequency of ordinary storms to the extreme, he calculated the odds that a Carrington-class storm would hit Earth in the next ten years.


The answer: 12%.


FEMA takes these solar storms seriously, and in 2010 held a major table-top exercise in anticipation of the upcoming solar maximum. According to a tweet from FEMA Director Craig Fugate back in 2011, they now include a solar weather update in their daily briefings.


A 30 page PDF file is available for download from the FEMA library on this exercise which envisioned a `near worst-case scenario’.

Managing Critical Disasters in the Transatlantic Domain - The Case of a Geomagnetic Storm


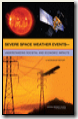
In 2009 the National Academy of Sciences produced a 134 page report on the potential damage that another major solar flare could cause in Severe Space Weather Events—Understanding Societal and Economic Impacts.

image

You can download the PDF for free from the National Academies Press at the above link.


In November of 2012 the U.S. National Intelligence Council released a report called  "Global Trends 2030: Alternative Worlds" that tries to anticipate the global shifts that will likely occur over the next two decades (see Black Swan Events). Making their top 10 list was:


7. Solar Geomagnetic Storms

"Solar geomagnetic storms could knock out satellites, the electric grid, and many sensitive electronic devices. The recurrence intervals of crippling solar geomagnetic storms, which are less than a century, now pose a substantial threat because of the world's dependence on electricity," the report says.


And last year Lloyds of London issued a risk assessment for the insurance industry called Solar storm Risk to the north American electric grid which calls another `Carrington’ class event inevitable, and the effects likely catastrophic, but the timing is unknowable.


Solar storms are among a number of plausible low-probability, high-impact events that – while not anything I would lie awake at night worrying about – are nevertheless worth considering as part of a balanced `All Hazards’ approach to preparedness.


In the 2011 OECD Report: Future Global Shocks report, the authors concentrated most of their attention on five highly disruptive future shock events.


  • A Pandemic
  • A Cyber Attack
  • A Financial Crisis
  • A Geomagnetic Storm
  • Social Unrest/Revolution


While all of these are difficult to prepare for, the truth is -  if you are well prepared for an earthquake or a hurricane - you are automatically in a better position to deal with the disruptions caused by these more exotic threats. Some resources to get you started on the road to `all threats’ preparedness include:


FEMA http://www.fema.gov/index.shtm

READY.GOV http://www.ready.gov/

AMERICAN RED CROSS http://www.redcross.org/


And some of my preparedness blogs, including:

When 72 Hours Isn’t Enough

The Gift Of Preparedness: 2013

In An Emergency, Who Has Your Back?

Monday, May 26, 2014

Hurricane Preparedness Week: Storm Surge

image 


# 8666


This is day two of 2014’s National Hurricane Preparedness Week and the focus today is on Storm Surge, traditionally the biggest cause of death from these killer storms. Having spent a good portion of my life as a liveaboard boater on Florida’s West coast, I can assure you from personal experience that storm surge can be both dramatic, and dangerous.


First stop, a short video from the NHC (National Hurricane Center), and a NHC description of storm surge, after which I’ll return with a bit more:

image


Storm Surge vs. Storm Tide
Storm surge is an abnormal rise of water generated by a storm, over and above the predicted astronomical tides. Storm surge should not be confused with storm tide, which is defined as the water level rise due to the combination of storm surge and the astronomical tide. This rise in water level can cause extreme flooding in coastal areas particularly when storm surge coincides with normal high tide, resulting in storm tides reaching up to 20 feet or more in some cases.


Storm Surge vs. Storm Tide
 

Back in 2011,  in Getting SLOSHed For Hurricane Season I wrote about the Sea, Lake and Overland Surges from Hurricanes computer model that emergency planners use to plan for coastal evacuations. In order to know in advance how far inland a storm surge or tide will encroach, emergency planners run hundreds of SLOSH models for populated regions along the coast. 


image


They vary the size, intensity, direction, and forward speed of hurricanes in the model in order to determine the worst case impact for each category of storm. Evacuation maps and routes are then generated using this information.

image

This evacuation map of Pinellas County (St. Petersburg-Clearwater) Florida shows that a storm even as low as a CAT 3 could temporarily cut the southern half of the county off from the north.


Of course much depends upon the speed, direction, and point of landfall of the storm, and so not all CAT 3 storms impacting this area would produce this dramatic of an effect. But if you are asked to evacuate by your local authorities, don’t hesitate.  


Just do it.


Which is why, the smart money is on deciding where you will go long before hurricane season arrives.  Public shelters are likely to be uncomfortable and crowded, and should really be your option of last resort.   A better plan is to pre-arrange with family or friends for a place to stay. 


As we discussed yesterday, this year, the NHC will be issuing enhanced color-coded experimental Potential Storm Surge Flooding Maps showing the locations that could be affected by storm surge based on their (SLOSH) computer models.


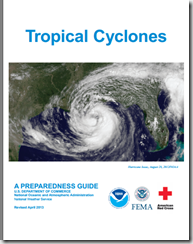
If you haven’t already downloaded the updated Tropical Cyclone Preparedness Guide, now would be an excellent time to do so.


image

Tuesday, May 21, 2013

Safety: Before And After The Storm

 image

AREAS UNDER THE GUN AGAIN TODAY

image


# 7299


While it may seem hard to believe after seeing the video coming out of the Midwest over the past 48 hours, 2013 has been – until now – one of the quietest tornado years in decades.


After a disastrous 2011 (see NOAA: Lessons From The Joplin Tornado), 2012 was a below-average year as well.  But even in a below-average year, major tornadoes can occur.

image


For the third day in a row, the Storm Prediction Center  in Norman, Oklahoma has issued an advisory for a `moderate risk’ of severe storms and possible tornadoes for parts of Texas, Oklahoma, Arkansas, and Louisiana, with a `slight risk’ is a swath from Texas to Michigan.


Some of the major cities under the gun later today include:

  • Dallas, TX
  • Ft. Worth, TX
  • Arlington, TX
  • Plano, TX
  • Garland, TX


The good news for rescue operations ongoing in Oklahoma is that today they are only under a `slight risk’ of severe weather. 


For tens of thousands – particularly in and around Moore, OK -  today is a day for cleanup and recovery, amid large scale power outages. 


This is a dangerous time, during which additional deaths and injuries may occur.


So today, a review of some safety information for after the storm passes. 


Perhaps not something that people in the tornado damage zone will be reading today, but hopefully of use for those who may be hit tomorrow, or next month, or later in Hurricane season.


The Peachtree City, Georgia NOAA weather page has some useful information on after-storm cleanup, including dealing with repair contractors. 


This is just an excerpt, follow the link for a lot more:


Safety After the Storm

Here are just a few safety tips...

  • Be aware of hazards from exposed nails and broken glass.
  • Do not touch downed power lines or objects in contact with downed lines. Report electrical hazards to the police and the utility company.
  • If it is dark when you are inspecting your home, use a flashlight rather than a candle or torch to avoid the risk of fire or explosion in a damaged home.
  • If you see frayed wiring or sparks, or if there is an odor of something burning, you should immediately shut off the electrical system at the main circuit breaker if you have not done so already.
  • If you smell gas or suspect a leak, turn off the main gas valve, open all windows, and leave the house immediately. Notify the gas company, the police or fire departments, or State Fire Marshal's office, and do not turn on the lights, light matches, smoke, or do anything that could cause a spark. Do not return to your house until you are told it is safe to do so.
  • For more information, visit the Centers for Disease and Prevention. They have a wealth of information about what to do in the aftermath of all sorts of events - like tornadoes, floods, hurricanes, and many more.


The use of generators, and improvised cooking or heating indoors, often results in (preventable) Carbon Monoxide poisonings.  Each year hundreds of Americans are killed, and thousands affected, by CO poisoning.


In Carbon Monoxide: A Stealthy Killer I wrote in depth on the issue, but a few tips from the CDC include:

Prevention Guidelines
You Can Prevent Carbon Monoxide Exposure
  • Do have your heating system, water heater and any other gas, oil, or coal burning appliances serviced by a qualified technician every year.
  • Do install a battery-operated CO detector in your home and check or replace the battery when you change the time on your clocks each spring and fall. If the detector sounds leave your home immediately and call 911.
  • Do seek prompt medical attention if you suspect CO poisoning and are feeling dizzy, light-headed, or nauseous.
  • Don't use a generator, charcoal grill, camp stove, or other gasoline or charcoal-burning device inside your home, basement, or garage or near a window.
  • Don't run a car or truck inside a garage attached to your house, even if you leave the door open.
  • Don't burn anything in a stove or fireplace that isn't vented.
  • Don't heat your house with a gas oven.


Food safety after a power outage is another concern after the storm, something I covered two years ago in USDA: Food Safety When The Power Goes Out.  

A few excerpts include:

The USDA maintains a Food Safety and Inspection website with a great deal of consumer information about how to protect your food supplies during an emergency, and how to tell when to discard food that may no longer be safe to consume.

First, an audio podcast (5 minutes).


Surviving a Power Outage: Don't Be in the Dark When it Comes to Food Safety (Jun 2, 2010; 4:45) | Script
FSIS Food Safety staff discusses tips on how to be food safe during a power outage.

The USDA also maintains a large repository of food safety information available to be read online, or downloaded as a pdf.


A Consumer's Guide to Food Safety: Severe Storms and Hurricanes

Note: This text-only version of the Guide has been optimized for accessibility. The illustrated PDF version (2.1MB) is recommended for printing.


Chainsaw accidents figure prominently after many weather-related disasters.  The CDC maintains a chainsaw safety webpage.  Excerpts follow:

Preventing Chain Saw Injuries During Tree Removal After a Disaster
image
Be aware of the risk of chain saw injury during tree removal

Each year, approximately 36,000 people are treated in hospital emergency departments for injuries from using chain saws. The potential risk of injury increases after hurricanes and other natural disasters, when chain saws are widely used to remove fallen or partially fallen trees and tree branches.


May and June are the peak months for Tornadoes in this country, and September is the peak of the Hurricane season.  


While it may seem as if the danger has passed once the clouds part, and the sun comes out, the truth is quite the opposite.


Now is a good time to follow these links and print out the information you may need - before the next big storm hits.


Yesterday’s storm also highlighted the need for everyone to have a family communications plan in case you and your loved ones are separated in a disaster.


To make things easier, READY.GOV has developed a Family Emergency Communications Kit, which can be downloaded free from the net. 


With just a few minutes effort, you can have your own emergency communications plan and emergency meeting place set up.


image

Make a Plan

Your family may not be together when a disaster strikes so it is important to plan in advance: how you will get to a safe place; how you will contact one another; how you will get back together; and what you will do in different situations. Read more about Family Communication during an emergency.

Ready.gov has made it simple for you to make a family emergency plan. Download the Family Emergency Plan (FEP) (PDF - 750 Kb) and fill out the sections before printing it or emailing it to your family and friends.


Together with adequate emergency supplies, a solid first aid kit, and an emergency battery operated NWS Weather Radio, preparing now will go a long ways to protecting you, and your family, from a wide variety of potential disasters.

Sunday, November 04, 2012

NWS: Possible Coastal Storm Mid-Week


image

Source CDC


# 6694


As I mentioned on Thursday (see A Worrisome Mid-Week Forecast), computer models are increasingly indicating a coastal storm/Nor’easter for the Mid-Atlantic & New England states later this week.


Not only will this increase the misery factor for residents and rescue workers dealing with the aftermath of Sandy, for those without power or heat temperatures and wind chills may drop dangerously low.


This is the latest Hazardous Weather Outlook from the New York NWS, issued early this morning:

HAZARDOUS WEATHER OUTLOOK


NATIONAL WEATHER SERVICE NEW YORK NY
339 AM EST SUN NOV 4 2012

THIS HAZARDOUS WEATHER OUTLOOK IS FOR SOUTHERN CONNECTICUT...NORTHEAST NEW JERSEY AND SOUTHEAST NEW YORK.

.DAY ONE...TODAY AND TONIGHT.

TEMPERATURES TONIGHT ARE EXPECTED TO FALL INTO THE 20S AND 30S.


THOSE WITHOUT POWER SHOULD PLAN FOR ANOTHER COLD NIGHT.

.DAYS TWO THROUGH SEVEN...MONDAY THROUGH SATURDAY.

LOW TEMPERATURES MONDAY NIGHT ARE EXPECTED TO FALL INTO THE 20S.


THOSE WITHOUT POWER SHOULD BE PREPARED FOR ANOTHER COLD NIGHT.

THERE IS THE POTENTIAL FOR A COASTAL STORM TO IMPACT THE TRI-STATE REGION WEDNESDAY AND THURSDAY.

THIS STORM HAS THE POTENTIAL TO BRING STRONG GUSTY WINDS...RAIN/WINTRY PRECIPITATION...COASTAL FLOODING AND ADDITIONAL BEACH EROSION TO THE TRI-STATE AREA.


STAY TUNED FOR THE LATEST FORECASTS.


The 7 day forecast for Newark, NJ gives a pretty good idea of the expected progression of the weather.

image


The concern here isn’t just for the cold, for every year we get tragic reports of people who either started a house fire, or succumbed to Carbon Monoxide poisoning, while trying to heat their homes during a power outage.


The sources of CO are numerous; faulty furnaces, snow blocked car exhaust pipes, attempts to use generators inside the house or garage . . . and the use of CO producing emergency heat sources all contribute to the winter body count.


The CDC’s MMWR released a report in 2005 called Unintentional Non--Fire-Related Carbon Monoxide Exposures --- United States, 2001—2003 that stated:


During 2001--2003, an estimated 15,200 persons with confirmed or possible non--fire-related CO exposure were treated annually in hospital EDs. In addition, during 2001--2002, an average of 480 persons died annually from non--fire-related CO poisoning. Although males and females were equally likely to visit an ED for CO exposure, males were 2.3 times more likely to die from CO poisoning. Most (64%) of the nonfatal CO exposures occurred in homes. Efforts are needed to educate the public about preventing CO exposure.


The CDC maintains a webpage on Carbon Monoxide, which you can access here, and has this short video on what they call the `quiet killer’.


Thursday, November 01, 2012

A Worrisome Mid-Week Forecast

image

Source NOAA HPC


# 6689


The very last thing that the residents of New England and the Mid-Atlantic states need right now is another storm to deal with, but early indications from NOAA’s HPC (Hydrometeorological Prediction Center) suggest a Nor'easter could be in store by the middle of next week.


The two forecast models above show the model runs for November 7th and November 8th. 


They show a low pressure area – potentially a winter storm – moving up the eastern seaboard during that time frame.


While six days out is a long way off, and the forecast could certainly change, any deterioration in the weather will make the recovery efforts in New York, New Jersey, and surrounding areas that much more difficult.


PRELIMINARY EXTENDED FORECAST DISCUSSION


NWS HYDROMETEOROLOGICAL PREDICTION CENTER COLLEGE PARK MD

947 AM EDT THU NOV 01 2012

VALID 12Z MON NOV 05 2012 - 12Z THU NOV 08 2012

...NOR'EASTER POSSIBLE FOR MID-ATLANTIC/NEW ENGLAND STATES BY ELECTION DAY INTO NEXT THURSDAY...

<SNIP>

GUIDANCE STILL HAVE SOME TIMING/STRENGTH ISSUES BUT COMMONLY AGREE THAT DEEPER LOW DEVELOPMENT WOULD OCCUR MON-THU AS A FRONTAL WAVE OFF THE SOUTHEAST MOVES SLOWLY OFFSHORE AND UP OFF THE EAST COAST.
THIS WOULD BRING BEST ORGANIZED RAINS FROM THE ERN MID-ATLANTIC TO COASTAL NEW ENGLAND.


A TRACK IN THIS VEIN OFFERS POTENTIAL FOR
HEAVIER SNOWS ACROSS INTERIOR NEW ENGLAND WEDNESDAY/THURSDAY AS THE LOW WRAPS INLAND.  INCREASING WINDS ALONG COASTAL NEW ENGLAND (AND POSSIBLY THE COASTAL MID-ATLANTIC STATES IF A MORE WESTERLY
TRACK VERIFIES) TUESDAY ONWARD MAY LEAD TO SOME COASTAL FLOODING AND BEACH EROSION.


IT SHOULD BE NOTED THAT THIS SYSTEM IS
EXPECTED TO BE MUCH WEAKER THAN HURRICANE SANDY AND PRODUCE IMPACTS MUCH LESS EXTREME AND MAINLY AWAY FROM THE REGION MOST
STRONGLY IMPACTED BY SANDY.

Obviously we’ll be watching these developments with keen interest, and the fervent hope that this storm fails to materialize.

Thursday, October 25, 2012

Sandy: Northeast Increasingly Under The Gun

image


# 6663


Looking like a gigantic question mark (?), the majority of the forecast models for (currently CAT 2 Hurricane) Sandy now have the storm making a sharp left turn towards the Northeast Coast early next week. 


Sandy’s eventual path, and strength at that time is impossible to gauge right now, but the NWS is asking East Coast residents to pay attention.


This from the NOAA  National Severe Storms Laboratory Facebook Page.


Pay attention east coast!


The majority of computer models have trended toward bringing the system north into the Atlantic just off of the Eastern Seaboard and taking a sharp left turn, ultimately moving into the Northeast. Where exactly the system will go remains up in the air. Models are showing the storm entering New Brunswick to as far south as southern NJ. More info as we get it and we will be following this extremely close over the next 3-4 days. Please share this graphic to keep family and friends informed.


While Sandy is unlikely to maintain hurricane status that far north this late in the year, residents anywhere from the Mid-Atlantic all the way up to the Maritimes need to pay attention, and be prepared to deal with what could be an extremely strong Nor’Easter or post-tropical storm.


This Hazardous Weather Outlook from NWS Boston, MA. issued today at 5:47am.


THIS HAZARDOUS WEATHER OUTLOOK IS FOR NORTHERN CONNECTICUT...CENTRAL MASSACHUSETTS ... EASTERN MASSACHUSETTS ... NORTHEASTERN MASSACHUSETTS  ... SOUTHEASTERN MASSACHUSETTS ...WESTERN MASSACHUSETTS ...SOUTHERN NEW HAMPSHIRE ...  NORTHERN RHODE ISLAND AND SOUTHERN RHODE ISLAND.

.DAY ONE...TODAY AND TONIGHT.

HAZARDOUS WEATHER IS NOT EXPECTED AT THIS TIME.

.DAYS TWO THROUGH SEVEN...FRIDAY THROUGH WEDNESDAY.

CONFIDENCE CONTINUES TO INCREASE FOR IMPACTS FROM SANDY...WHETHER IN TROPICAL OR POST TROPICAL FORM...EARLY NEXT WEEK. THE REGION
COULD SEE EITHER A CLOSE PASS OR A DIRECT HIT FROM LATE MONDAY TO TUESDAY AND BEYOND. IMPACTS MAY INCLUDE HIGH SEAS AND STORM SURGE THAT COULD COMBINE WITH HIGH ASTRONOMICAL TIDES TO PRODUCE COASTAL FLOODING...WIND GUSTS POTENTIALLY REACHING HURRICANE FORCE CAUSING DOWNED TREES AND POWER LINES AS WELL AS HEAVY RAINFALL
RESULTING IN INTERIOR FLOODING.


Anyone living in the path of this storm, including those living inland, should be making preparations now to deal with it’s arrival.  


When it comes to getting the latest information on hurricanes, your first stop should always be the National Hurricane Center in Miami, Florida. These are the real experts, and the only ones you should rely on to track and forecast the storm.


The second official information source you should have bookmarked is your local Office of Emergency Management.  There you will find information about evacuation zones, shelters, and emergency decrees in your area.


If you are on Twitter, you should also follow @FEMA, @CraigatFEMA, @NHC_Atlantic, @NHC_Pacific and @ReadydotGov.


Whether Sandy retains tropical characteristics or not, If you haven’t already downloaded the Tropical Cyclone Preparedness Guide, now would be an excellent time to do so. It is a short (12-page), easy to follow guide that will walk you through the basics of understanding (and surviving) hurricanes and tropical storms.

image

Monday, May 28, 2012

Storm Surge Monday


# 6351


Today is day two of Hurricane Preparedness week, with today’s emphasis on deadly storm surge.


image


First a short video from the NHC on storm surge, then a visit to their storm surge information page.


Storm Surge Overview

Along the coast, storm surge is often the greatest threat to life and property from a hurricane. In the past, large death tolls have resulted from the rise of the ocean associated with many of the major hurricanes that have made landfall. Hurricane Katrina (2005) is a prime example of the damage and devastation that can be caused by surge. At least 1500 persons lost their lives during Katrina and many of those deaths occurred directly, or indirectly, as a result of storm surge.

Storm Surge vs. Storm Tide
Storm surge is an abnormal rise of water generated by a storm, over and above the predicted astronomical tides. Storm surge should not be confused with storm tide, which is defined as the water level rise due to the combination of storm surge and the astronomical tide. This rise in water level can cause extreme flooding in coastal areas particularly when storm surge coincides with normal high tide, resulting in storm tides reaching up to 20 feet or more in some cases.


Storm Surge vs. Storm Tide

(Continue . . . )


Last year in Getting SLOSHed For Hurricane Season I wrote about the Sea, Lake and Overland Surges from Hurricanes computer model that emergency planners use to plan for coastal evacuations.

In order to know in advance how far inland a storm surge or tide will encroach, emergency planners run hundreds of SLOSH models for populated regions along the coast. 

image

They vary the size, intensity, direction, and forward speed of hurricanes in the model in order to determine the worst case impact for each category of storm.


Evacuation maps and routes are then generated using this information.

image

This evacuation map of Pinellas County (St. Petersburg-Clearwater) Florida shows that a storm even as low as a CAT 3 could temporarily cut the southern half of the county off from the north.


Of course much depends upon the speed, direction, and point of landfall of the storm, and so not all CAT 3 storms impacting this area would produce this dramatic of an effect.


But if you are asked to evacuate by your local authorities, don’t hesitate. 


Just do it.

Monday, April 09, 2012

NASA: The Mysteries Of The Sun


image


# 6269


Although the sun is relatively quiet this week the next solar maximum – a period of greatest solar activity (sun spots, flares, CMEs) that occurs roughly every 11 years – is expected early in 2013.


It is during these solar maximums where the earth is at greatest risk of experiencing a major solar flare, something that if strong enough, could adversely affect satellites in orbit, sensitive electronics on the ground, and even the electrical grid.


Scientists at NASA, NOAA, and other agencies . . .  including FEMA  . . .  take the potential for destructive Solar storms very seriously, and in early 2010 FEMA held a major table-top exercise in anticipation of the upcoming solar maximum (see Solar Storms, CMEs & FEMA).


But despite some of the more dire warnings on the internet, NASA is quick to remind us that a damaging solar flare – while possible – may be decades away.


With the interest in the upcoming solar maximum running high, NASA has put together five short videos and a PDF book on the sun, which is  available on their Stars & Our Sun webpage.


image

20 page PFD book


The five videos are:


Space Weather

Solar Variability

Heliosphere

Earth's Magnetosphere

Ionosphere, Thermosphere, and Mesosphere


Each segment runs about 5 minutes in length, and all incorporate impressive graphics and informative narration. According to the press release, these videos have already won a number of prestigious awards prior to their public release.


I confess that I’m enough of a science geek to greatly appreciate these kind of films. My fascination with science goes back to the still delightful Bell System Science series of the 1950s, which introduced my post-war baby boom generation to science and research.


For a simpler retro look at the sun, and to compare how much we’ve learned over the past 54 years (in science and filmmaking), you may enjoy watching the classic educational film  OUR MR. SUN from 1956, staring Dr. Frank Baxter and Eddie Albert which is available on the Internet Archive.


image

Dr. Research (Frank Baxter)


What this old film lacks in 21st century science, it makes up with charm.

Tuesday, February 28, 2012

It Happens Every Spring


image

Credit NOAA – NWS Storm Prediction Center


# 6178


For very good reasons, during the months of February and March many states across the nation – particularly in the mid-west and the deep south – promote a Severe Weather Awareness Week.


Last year’s record breaking tornado season, which claimed the highest number of lives in a half century, serves as a stark reminder of just how vulnerable we are to these violent weather events.


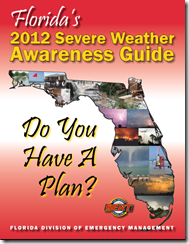
NOAA provides a State by State listing of Weather Awareness Events, and some states publish severe weather preparedness guides.  A few examples follow, but you can Google `Severe Weather Awareness’ and your State’s name, to see if one is available for your area.


image

image


Some states have Severe Weather Guides online, such as this website maintained by the Texas Department of Public Safety.


image


While it is impossible to predict just what kind of spring and summer storm season we will see, when warm moist air to the south and east does battle with cooler or drier air masses to the north and west, you have the basic ingredients for severe weather.  


And outbreaks of tornadoes can frequently result. 


But it isn’t just tornadoes that we watch out for. Straight line winds, downbursts, hail, lightning, and torrential rains are also hazards carried by these storms, and all can be deadly.


image


March, April, May and June generally see the strongest, and most frequent tornadoes, but in truth - these violent windstorms can occur any time of the year - particularly in the south. 


image

In an average year, more than 1,000 tornadoes are reported in the United States.   It is likely that the actual number is considerably higher, as not all tornadoes occur in areas where they can be seen or confirmed.


All but a small part of the United States is vulnerable to these storms, but the strongest of these storms generally occur in an area we call Tornado Alley (below Left), which runs from middle Texas north though Oklahoma, Kansas, Nebraska and South Dakota.


This is the area where you will generally find the largest and most powerful tornadoes; the F5 wedge type. 


image

TORNADO ALLEY                       DIXIE ALLEY


Fortunately, much of the mid-west is sparsely populated, and so the number of tornado deaths that occur here are actually less than in other areas of the country.   


DIXIE ALLEY (above right) sees more frequent, albeit usually less severe tornadoes.  Due to a higher population density, more deaths occur in Dixie Alley than in Tornado Alley most years.


To keep abreast of severe storm forecasts, you can visit NOAA’s Storm Prediction Center online.  There you’ll find interactive maps showing current and anticipated severe weather threats all across the nation.


image

image


Another resource is NOAA WEATHER RADIO.


Once thought of as mainly a source of local weather information, it has now become an `All-Hazards' alert system as well.


In order to receive these broadcasts, you need a special receiver.  Many of these radios have a special `Tone Alert', and will begin playing once they receive a special alert signal from the broadcaster.


Like having an emergency kit, a first aid kit, and a portable AM/FM radio - having a weather radio is an important part of being prepared. 


Most Americans are woefully unprepared to deal with emergencies.  This despite dozens of major disasters (often weather related) that occur every year in this country. 


Agencies like FEMA, READY.GOV and the HHS are constantly trying to get the preparedness message out, so that when (not `if') a disaster does occur, human losses can be minimized.


For more information on how to prepare for emergencies, up to and including a pandemic, the following sites should be of assistance.


FEMA http://www.fema.gov/index.shtm

READY.GOV http://www.ready.gov/

AMERICAN RED CROSS http://www.redcross.org/

Saturday, June 11, 2011

A Flare For The Dramatic


# 5620


image

An M2 (medium) Class solar flare, with CME and an S1 (minor) Class Radiation storm recorded by NASA on June 7th, 2011.


Although sunspot activity remains relatively low, and the arrival of the next solar maximum (which occurs every 11-13 years) appears to be running a bit behind schedule, this week’s spectacular solar eruption is a reminder that the sun is indeed beginning to awaken from its prolonged quiescence. 


In this case, the accompanying spectacular CME (Coronal Mass Ejection) only provided a mild, glancing blow to the earth, and aside from sparking some high latitude auroras, had little effects.


But Scientists at NASA, NOAA, and other agencies . . .  including FEMA  . . .  take the potential for destructive Solar storms very seriously.


While they often occur simultaneously, Solar Flares and CMEs are not the same.  


A Solar Flare is the brief, sudden release of radiation energy (X-Ray, Gamma Rays, & energetic particles (protons and electrons)) from the surface of the sun, generally in the vicinity of an active sunspot.


Solar flares are rated as either C Class (minor), M Class (Moderate), or X Class (extreme), and while the electromagnetic radiation they release can reach earth in only about 8 minutes time, their effects are mostly limited to disrupting communications and potentially damaging satellites.


A CME (Coronal Mass Ejection) is the ejection of a massive amount of plasma (electrons and protons & small quantities of helium, oxygen, and iron) from the the sun that may last for hours. Some of this plasma falls back into the sun, but trillions of tons can escape and if aimed in their direction, impact surrounding planets.


A CME may arrive on earth – 93 millions miles distant from the sun – 48 to 72 hours after it is observed, and spark a Geomagnetic Storm.   


While they pose no direct physical danger to us on the earth’s surface (we are protected by the earths magnetic field and atmosphere), a large CME can wreak havoc with electronics, power generation, and radio communications.


Geomagnetic storms are rated as running from Minor (G1) to Extreme (G5) on NOAA Space Weather Scales.


While G1-G3 level geomagnetic storm poses little threat, the potential for damage goes up at G4 and above. I’ve excerpted the G5 description.


G 5

Extreme

Power systems: : widespread voltage control problems and protective system problems can occur, some grid systems may experience complete collapse or blackouts. Transformers may experience damage.

Spacecraft operations: may experience extensive surface charging, problems with orientation, uplink/downlink and tracking satellites.

Other systems: pipeline currents can reach hundreds of amps, HF (high frequency) radio propagation may be impossible in many areas for one to two days, satellite navigation may be degraded for days, low-frequency radio navigation can be out for hours, and aurora has been seen as low as Florida and southern Texas (typically 40° geomagnetic lat.)**.


FEMA takes all of this very seriously, and in early 2010 they held a major table-top exercise in anticipation of the upcoming solar maximum. According to a tweet from FEMA Director Craig Fugate last February, they now include a solar weather update in their daily briefings.


A 30 page PDF file is available for download from the FEMA library on this exercise which envisioned a `near worst-case scenario’.

Managing Critical Disasters in the Transatlantic Domain - The Case of a Geomagnetic Storm

Resource Record Cover Image Thumbnail - summary_geomag_cvr_web.jpg

An excerpt from this report’s forward reads:


Unlike natural hazards that we have faced in the past, disasters caused by abnormal solar activity could pose a worldwide threat and disrupt energy supplies, air transport, telecommunications, and other critical infrastructure.


Addressing such a large-scale disaster in purely national terms is not sufficient and requires international collaboration.


Last year NPR produced a news report, and a brief All Things Considered audio report on this exercise.


Solar Storms Could Be Earth's Next Katrina

by Jon Hamilton February 26, 2010


While sounding a bit like science-fiction, and being used as fodder by prophesy/ Mayan 2012/ End-of-the-World fringe websites, the truth is exceptionally large and disruptive solar storms do occur on rare occasions – usually at the time of a solar maximum.


NASA, while admitting that a serious solar storm could happen practically anytime, also cautions that the next big one could be many decades away. It is a genuine threat, they say, but the timing is impossible to predict.


In 2009 the National Academy of Sciences produced a 134 page report on the potential damage that another major solar flare could cause in Severe Space Weather Events—Understanding Societal and Economic Impacts.

image

You can download the PDF for free from the National Academies Press at the above link.


Large CMEs have occurred before, and have struck the earth.


I wrote about the most famous one that struck back in the 1800s in my blog A Carrington Event. Fortunately this massive CME happened before mankind developed, and became highly dependent upon, our modern electronic infrastructure.


A repeat performance today could cause widespread disruption.


Since it would require a massive CME of the correct polarity (opposite of the earth’s magnetosphere), aimed at where the earth will be 2 to 3 days hence . . . a lot of things would have to happen just right in order for the earth to experience a hugely destructive G5 Geomagnetic storm.


Which means that you shouldn’t lie awake at nights worrying about an impending solar storm apocalypse.


But you should be making serious individual, family, and business `All Threats’ disaster preparations, since the range of threats is large, and expanding.


If you are well prepared for an earthquake, a tornado, hurricane, or a pandemic . . . you are automatically in a better position to weather the disruptions caused by a rare solar storm or an even more unlikely Zombie Apocalypse (see The CDC And The Zombie Apocalypse).


Some resources to get you started on the road to `all threats’ preparedness include:


FEMA http://www.fema.gov/index.shtm

READY.GOV http://www.ready.gov/

AMERICAN RED CROSS http://www.redcross.org/


And a few of my (many) preparedness essays include:

An Appropriate Level Of Preparedness
Inside My Bug Out Bag
Red Cross Unveils `Do More Than Cross Your Fingers’ Campaign
The Gift Of Preparedness


You can search this blog for more preparedness information by clicking this link.

Tuesday, May 24, 2011

SPC: Another Major Severe Weather Threat Today


# 5569


image


The Storm Prediction Center in Norman Oklahoma has issued their 1 day convective outlook for May 24th, 2011, and they are calling for a high risk of severe thunderstorms (including hail, high winds, and tornadoes) across parts of Kansas and Oklahoma.


SPC AC 240559
  DAY 1 CONVECTIVE OUTLOOK 
  NWS STORM PREDICTION CENTER NORMAN OK
  1259 AM CDT TUE MAY 24 2011
  VALID 241200Z – 251200Z


...THERE IS A HIGH RISK OF SVR TSTMS ACROSS PARTS OF SOUTH CENTRAL AND SOUTHEAST KANSAS SWD INTO PARTS OF CENTRAL AND EASTERN  OKLAHOMA...

...THERE IS A MDT RISK OF SVR TSTMS ACROSS CENTRAL AND SOUTHEAST KANSAS...CENTRAL AND EASTERN OKLAHOMA...AND INTO WESTERN ARKANSAS...


...THERE IS A SLGT RISK OF SVR TSTMS FROM NEW ENGLAND SWD TO THE   MID-ATLANTIC REGION ... AND WWD INTO THE PLAINS...


After a record breaking number of tornadoes in April, the first three weeks of May – which is normally quite active – saw a marked decrease in severe weather reports around the nation.


All of that changed two days ago when nearly 50 twisters, and more than 700 reports of severe weather were recorded over a 24 hour period – including the horrific events in Joplin, Missouri ( see The Joplin Tornado: Search & Rescue Continues).


While it is impossible to predict exactly when and where tornadoes will strike, when atmospheric conditions set up as they appear to be doing today, severe weather somewhere in the watch area is almost certain to occur.


NOAA Radioimage

image image


No matter where you live, this morning would be a good time to check your NOAA weather radio, flashlights, and first aid kit. 


You should also review your family’s emergency communication plan - and if you haven’t already done so - decide where you would go in your home or business if a tornado threatens.


While we can’t prevent disasters like the one that befell Joplin, Missouri on Sunday . . .  we can be better able to deal with them.


To become better prepared as an individual, family, business owner, or community to deal with these types of disasters: visit the following preparedness sites.


FEMA http://www.fema.gov/index.shtm

READY.GOV http://www.ready.gov/

AMERICAN RED CROSS http://www.redcross.org/